Analyzing customer distribution using Pega Value Finder
3 Tasks
30 mins
Scenario
U+ Bank is currently cross-selling on the web by showing various credit cards to its customers.
They want to run a value finder simulation in Pega Customer Decision Hub™ to check if there are any under-engaged customers and customers without any actions, so that they can serve them better.
Use the following credentials to log in to the exercise system:
| Role | User name | Password |
|---|---|---|
| Next-Best-Action Designer | NBADesigner | rules |
Your assignment consists of the following tasks:
Task 1: Prepare the data set for the simulation run
Run the PrepareSimulationData data flow to prepare the data set for the simulation run.
Note: The SampledCustomers_Inbound data set is not available in a persisted store. To initialize the customer data, you must first run the PrepareSimulationData data flow.
Task 2: Create and execute a value finder simulation
Create and execute a value finder simulation for the Grow issue and Credit cards group. Use the SampledCustomers_Inbound data set as the audience.
Task 3: Inspect the simulation results
Inspect the result of the simulation by answering the following questions.
- How many customers receive irrelevant actions because of arbitration?
- What percentage of customers are well-served in the first Customer group from the only irrelevant actions after the eligibility customer category?
- How many customers are left without actions after the suitability condition is applied?
Challenge Walkthrough
Detailed Tasks
1 Prepare the data set for the simulation run
- On the exercise system landing page, click Pega CRM suite to log in to Customer Decision Hub.
- Log in to Customer Decision Hub as a Next-Best-Action Designer:
- In the User name field, enter NBADesigner.
- In the Password field, enter rules.
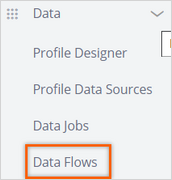
- In the navigation pane of Customer Decision Hub, click Data > Data Flows to view the list of data flows.
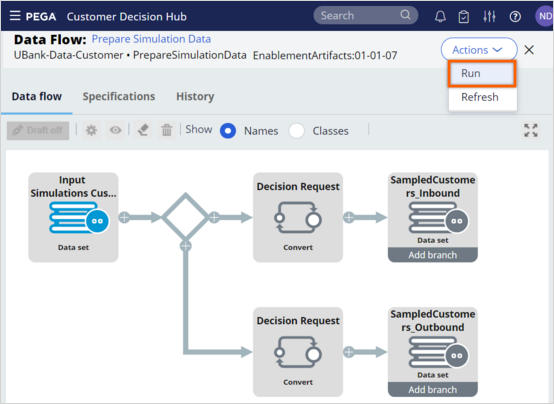
- In the list of data flows, search for and then open the PrepareSimulationData data flow, to prepare the data set that you use for the simulation.
This data is based on a Monte Carlo data set, which is generated by the system.Note: The Monte Carlo data set consists of mock data. As a result, different simulation runs have different results.
- Click Actions > Run to open the data flow work item.
- Click Submit.
- Click Start to process the data, and then wait for the processing to complete.
Note: Notice that the prospect data is populated once the test run is complete.
- Close the data flow.
2 Create and execute a value finder simulation
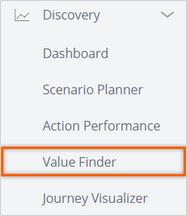
- In the navigation pane of Customer Decision Hub, click Discovery > Value Finder to open the Value Finder landing page.
- Click Create new to create a new value finder simulation.

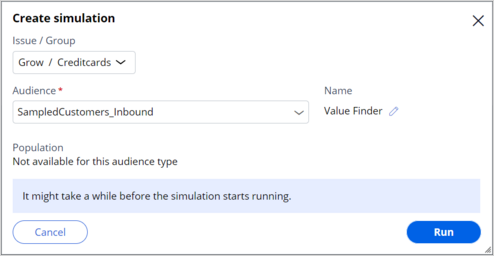
- In the Create simulation dialog box, configure the following information:
- Click the Issue / Group list.
- In the Issue list, select Grow.
- In the Group list, select Credit cards.
- Click Apply.
- In the Audience field, enter or select SampledCustomers_Inbound.
- In the Name field, click the pencil icon, and then enter Value Finder and submit.
- Click the Issue / Group list.
- Click Run to run the simulation. Once the run is complete, the system displays the results.
Note: The Monte Carlo data set consists of mock data. Therefore, different simulation runs will have different results.
3 Inspect the simulation results
- On the Customer engagement chart, note the numbers for the Receiving no actions, receiving only irrelevant actions, and Receiving at least 1 relevant action customer distributions.
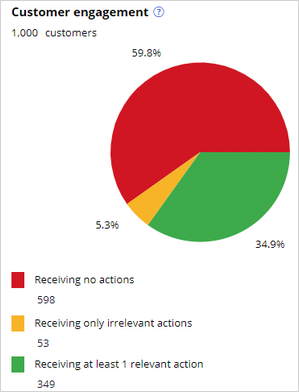
Question: How many customers are left without actions after the system applies arbitration conditions?
- Expand the Only irrelevant actions after arbitration customer category to view the opportunity recommendations made by the system.
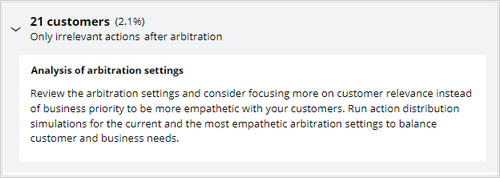
- Minimize the Only irrelevant actions after arbitration customer category.
Question: What percentage of customers are well-served in the first Customer group from the Under-served customers after the eligibility category? - Expand the Only irrelevant actions after eligibility customer category to inspect the information.
Note that the recommendation and the top discovered customer groups identified by the system. Note the number of customers filtered out for each customer group. - Click View.
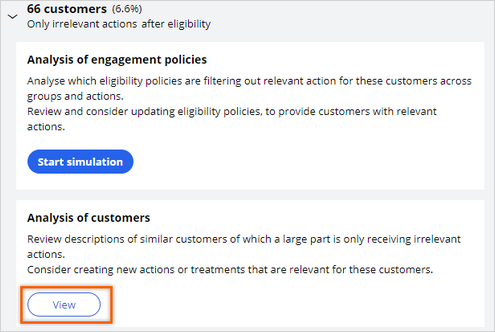
Note that you do not see any groups identified by the system because of the low number of customers receiving only irrelevant actions. Similarly, you can also inspect the Only irrelevant actions after applicability and suitability customer categories.
Note: To see what groups can be discovered by the system, you must increase the Propensity threshold. This results in an increased number of customers with only irrelevant actions. Best practice is to keep the Propensity threshold at 5%, but for training purposes it needs to be increased. - Minimize the customer categories.
- Click the gear icon to the right of Relevant action.
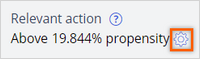
- In the Relevant action window, drag the bar to the right until the percentage of customers defined as receiving only irrelevant actions reaches 15%.
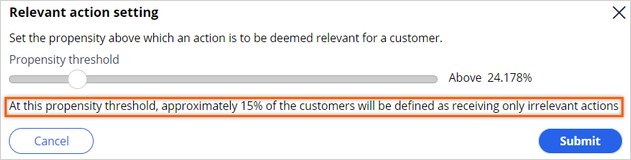
- Click Submit.
- Expand the Only irrelevant actions after eligibility customer category to understand the recommendations and the top discovered customer groups after the Propensity threshold modification.
The number of customers in this category has increased as a result of increasing the relevant action threshold. - Click View.
- Note the number of customers filtered out per customer group.
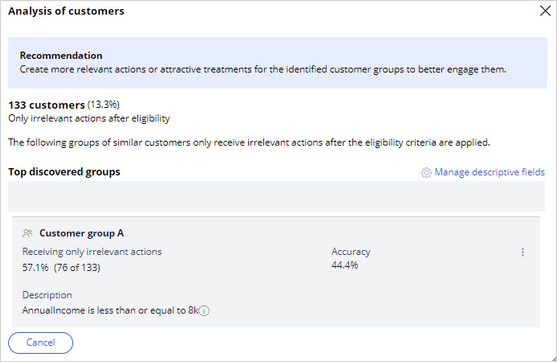 Tip: The accuracy of the first customer group, A, is 44.4%. As a result, the percentage of well-served customers in group A is 100 – 44.4 = 55.6%.
 - On the right, click Manage Descriptive fields to view the fields used by the system to categorize the customers into different groups.
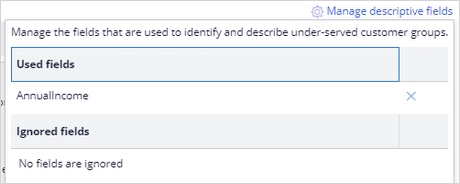
- Close the window.
Question: How many customers receive no actions due to the suitability conditions? - In the Customer categories section, note how the system identifies the recommendations for the current engagement policy conditions.
Note: The recommendations help you identify when the customers are filtered out from receiving an action.
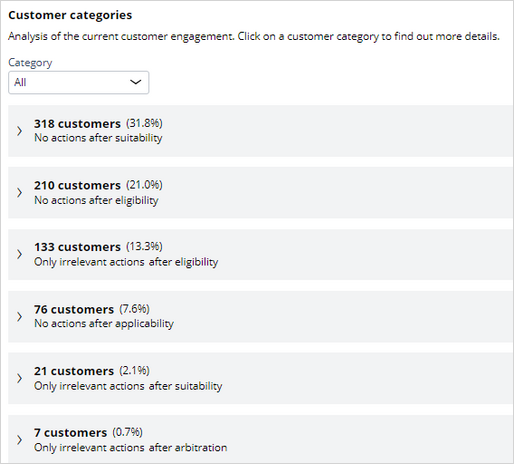 Tip: 318 customers are not served due to suitability conditions.
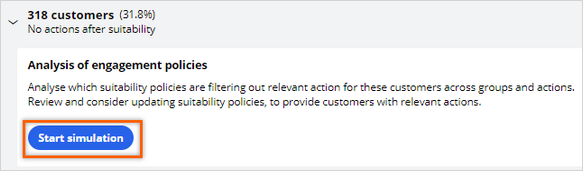
 - Expand the No actions after suitability customer category to view more details.
- In the Analysis of engagement policies section, click the Start simulation button to view which suitability policies customers are not passing across groups and actions.
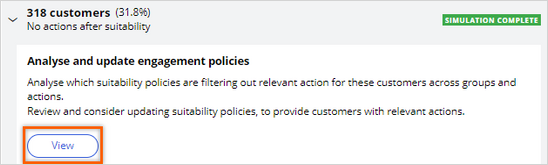
- Once the simulation is complete, click View.
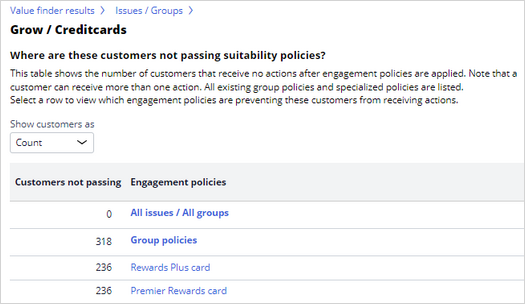
- Click Grow / Creditcards to view action-level policies that the customers are not passing.
- Inspect the table to see how many customers do not receive an action after the engagement policies are applied.
- Click Rewards Plus card, and then expand Customer Grow / Creditcards / RewardsPlusCard to view the specific suitability policies that the customers are not passing.
- Click Add to Value summary to add a specific engagement policy to the Value summary.
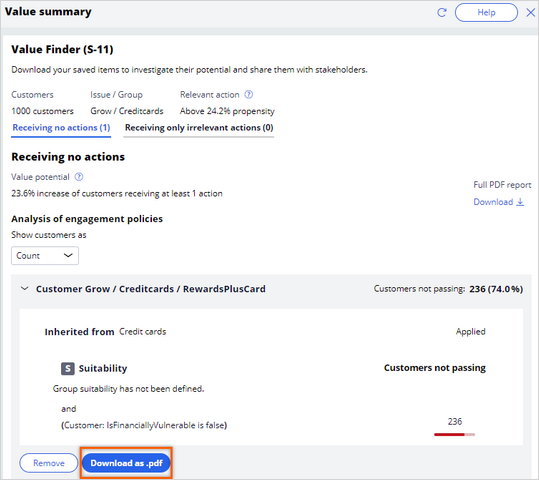
- In the upper-right corner of the Value Finder screen, click Value summary.
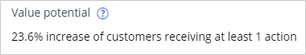
Note that there is now a higher potential increase of customers that receive at least one action. By adding engagement policies to the Value summary, you are implying a change in that policy that can potentially result in the increase shown in the Receiving no actions section.
- Expand the Customer Grow / Creditcards / RewardsPlusCard section.
- Click Download all as .pdf to save all the policies that are added to the summary.
This Challenge is to practice what you learned in the following Module:
Available in the following mission:
If you are having problems with your training, please review the Pega Academy Support FAQs.
Want to help us improve this content?