Demonstrating adaptive learning
Archived
4 Tasks
20 mins
Scenario
U+ Bank is about to implement adaptive models in the web channel to increase the click-through rates of the banners that promote their four credit cards. As a data scientist, you are asked to demonstrate that the models correctly detect potential predictors of customer interest.
As this is the implementation phase, no actual customer data is currently available. Therefore, you use a Monte Carlo data set, which provides random data for 10.000 customers to create simulated customer data. Customer response data is also not available at this stage, so you need to simulate customer responses.
To train the models, you run a Make Decision data flow that references the adaptive models and a Capture Response data flow that manipulates the customer responses to three of the credit cards based on their age, gender, and average spending properties. For comparison, the responses for the Standard Card are random.
To demonstrate that the adaptive model correctly detects age, gender, and average spending as strong predictors for customer interest, open the model report and the predictor reports and confirm that these properties are detected as strong predictors of customer behavior.
Use the following credentials to log in to the exercise system:
| Role | Username | Password |
|---|---|---|
| Data Scientist | DataScientist | rules |
Your assignment consists of the following tasks:
Task 1: Populate the customer data set
Build and run a data flow that uses the MonteCarlo data set as input and stores the simulated customer data in the CustomerData Decision Data Store.
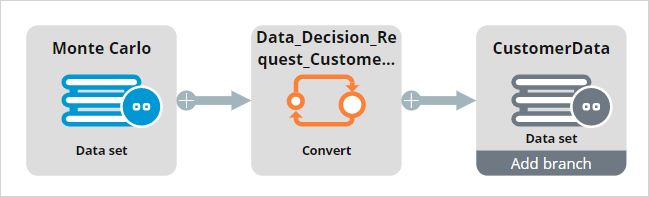
Note: You need to create the data flow on the Data-Decision-Request-Customer class. The data flow will ingest the MonteCarlo data set, then set the pySubjectID to .Customer.CustomerID using a Convert shape, and finally write the results to CustomerData data set.
Task 2: Make decisions
Run the MakeDecision_Demo data flow in the Data-Decision-Request-Customer class that references the Web_Click_Through adaptive model on 10.000 customers.
Task 3: Capture responses
Run the CaptureResponse_Demo data flow that introduces a bias in the customer responses based on the Age, Gender and AverageSpent customer properties.
Note: Inspect the ResponseStrategy used in the data flow. Specifically have a look at the RewardsCard scorecard to see which values of the Age and which values of AvergageSpent would result in a higher score, meaning a higher probability of a positive response.
Task 4: Demonstrate adaptive learning
Demonstrate that the adaptive model detects the Age and AverageSpent customer properties as strong predictors of customer interest.
Challenge Walkthrough
Detailed Tasks
1 Populate the customer data set
- Log in as a Data Scientist with user name DataScientist and password rules.
- In the navigation pane on the left, click Data > Data Flows.
- On the Data Flows landing page, click Create.
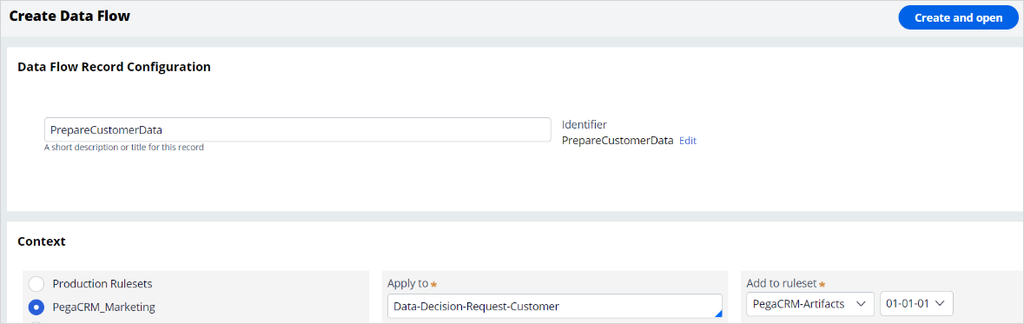
- In the Create Data Flow tab, enter the following information:
- In the short description text box, enter PrepareCustomerData.
- In the Apply to field, enter Data-Decision-Request-Customer.
- Click Create and open.
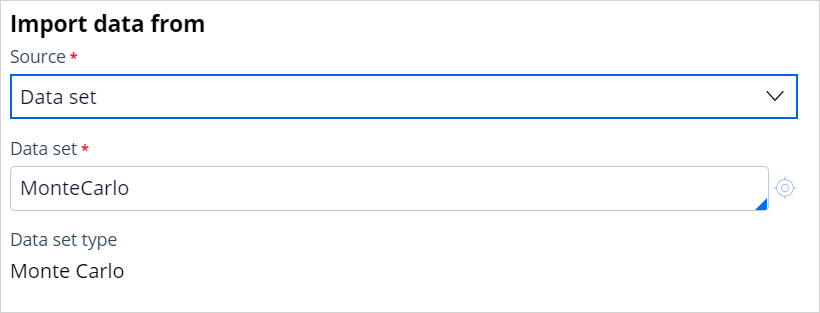
- On the data flow canvas, right-click the blue source component, and then select Properties.
- In the Import data from dialog box, in the Source list, select Data set.
- In the Data set field, enter or select MonteCarlo.
- Click Submit to close the Import data from dialog box.
- On the MonteCarlo component, click the Add icon, and then select Convert.
- Right-click the Convert component, and then select Properties.
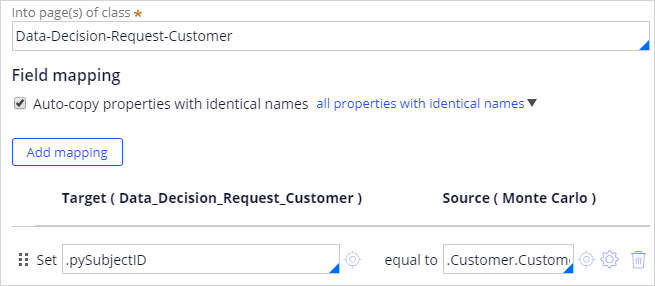
- Configure the component to convert into page(s) of class Data-Decision-Request-Customer.
- Enable Auto-copy properties with identical names.
- Click Add mapping, and then set .pySubjectID equal to .Customer.CustomerID.
- Click Submit.
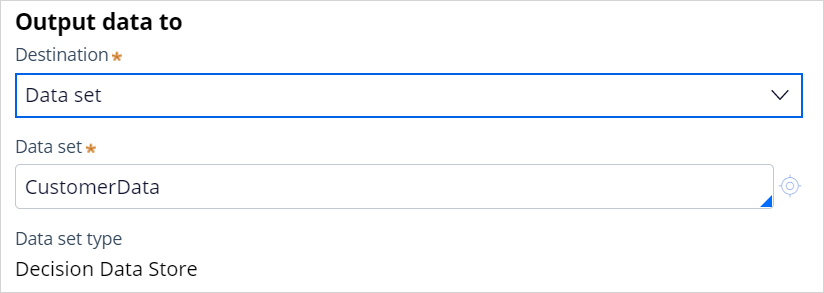
- Right-click the grey destination component, and then select Properties.
- In the Destination list, select Data set.
- In the Data set field, enter or select CustomerData.
- Click Submit.
- Click Save.
- Click Actions > Run.
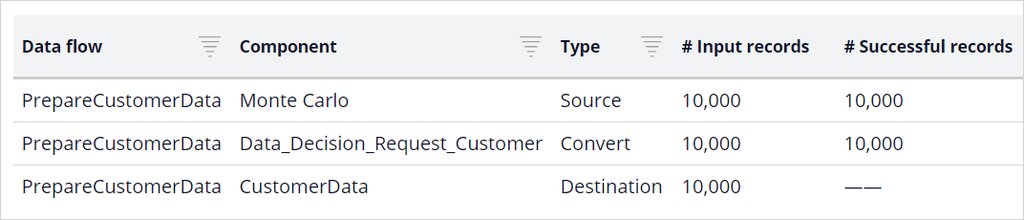
- Scroll down and verify that the 10,000 records are processed in the last shape.
- Close the Data flow test run window and the PrepareCustomerData data flow.
2 Make decisions
- On the Data Flows landing page, double-click MakeDecision_Demo to open the data flow.
- Right-click on the first shape, and then select Preview to open the Input Data Preview window.
- In the Input data preview window, expand one of the results. Notice that the result contains the pySubjectID and the customer data.
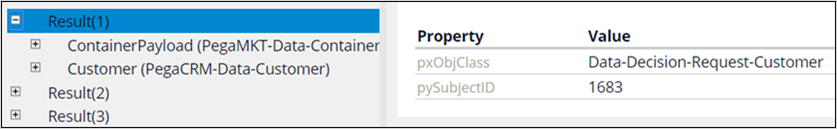
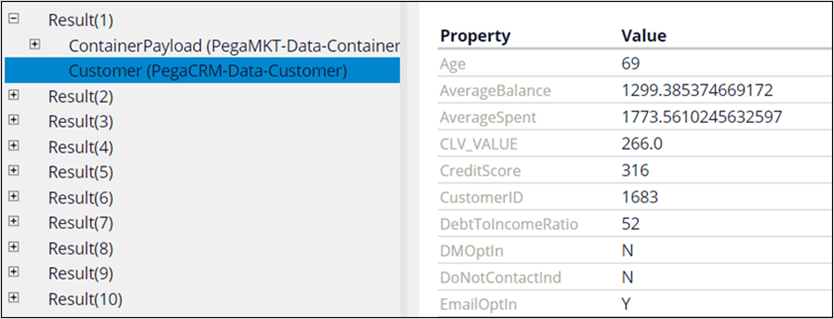
- Close the Input Data Preview window.
- Click Actions > Run.
Note: Please allow some time for the data flow to start up.
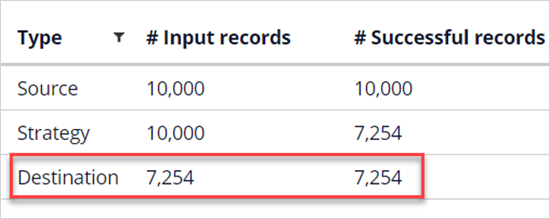
- Confirm that a decision has been made for a subset of the 10,000 customers (the exact number may vary due to the randomness of the data generated by the Monte Carlo data set). Note that from the entire 10,000 customer population, roughly 7,000 get an offer. The rest are not receiving any offer due to implemented contact policies (eligibility, applicability, and suitability rules).
- Close the Data flow test run window.
- Right click on the second shape and select Preview to open the Input Data Preview window.
- In the Input Data Preview window, expand one of the results. Notice that the result contains the customer data and the decision made by the strategy.
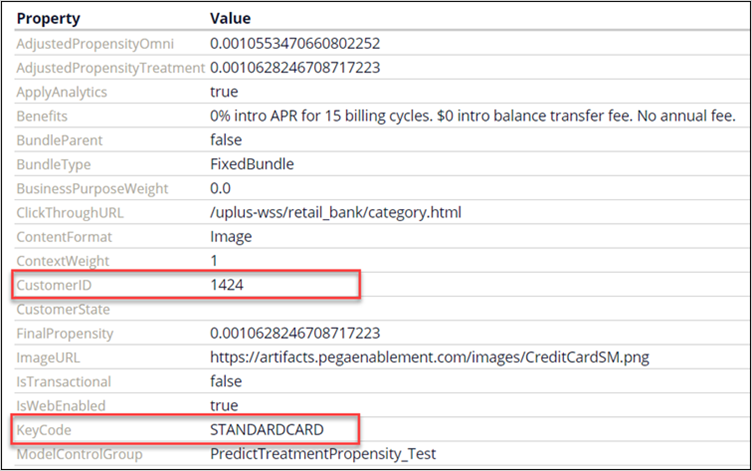
- Close the Input Data Preview window and the MakeDecision_Demo data flow.
3 Capture responses
- On the Data Flows landing page, double-click CaptureResponse_Demo.
- On the canvas, open the properties of the Decision strategy component.
- Click the Gear icon next to the Strategy field to open the ResponseStrategy.

- All offers receive a fraction of random offers. Notice that this fraction (the .RandomPopulation property) is set to 100% for the StandardCard offer, so it only receives random responses,
while the random offer fraction for Rewards Card is set to 15%.
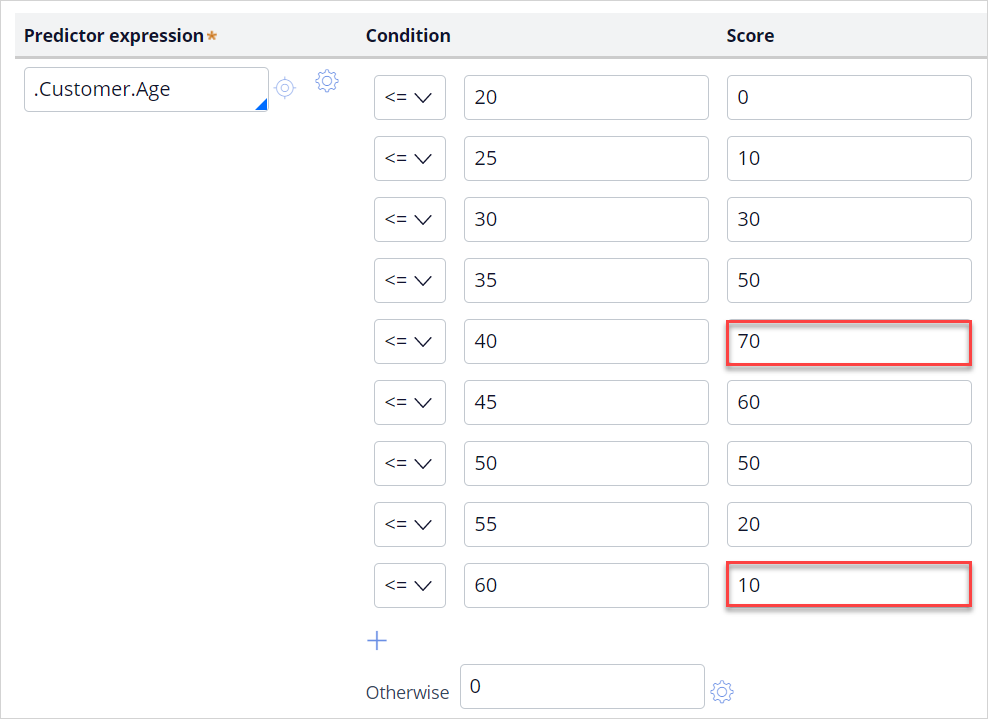
- On the strategy canvas, open the properties of the RewardsCard SC scorecard model component, and then select Open Scorecard. Notice that customers in their 30s have a higher score then those in their 50s.
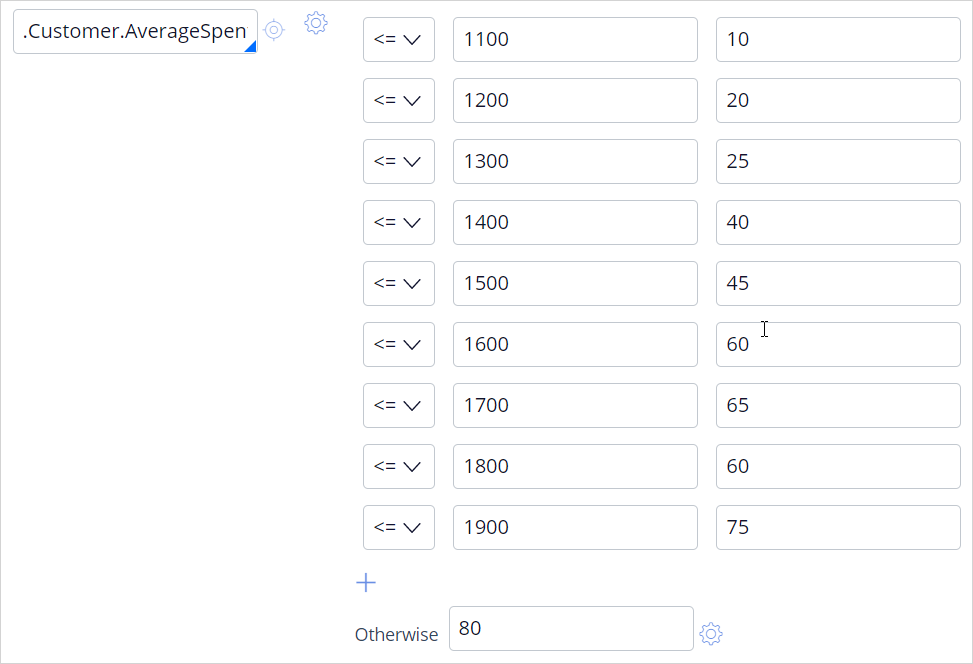
- Scroll down, and notice that customers with a high .AverageSpend property have a higher score.
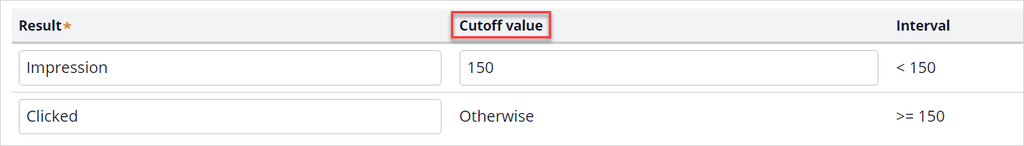
- Scroll up and click the Results tab. Notice that the response model is set up in such a way that customers with a higher score, a score value above the Cutoff value, are segmented as interested (Clicked).
- Close the score card and the response strategy.
- Return to the CaptureResponse_Demo data flow, and then click Actions > Run.
- Confirm that the responses have been captured for the roughly 7,000 customers to whom an offer has been made.
- Close the Data flow test run window.
4 Demonstrate adaptive learning
- In the navigation pane on the left, click Intelligence > Prediction Studio.
- Open the Web_Click_Though_Rate adaptive model.
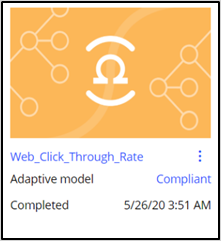
- Click Refresh data.
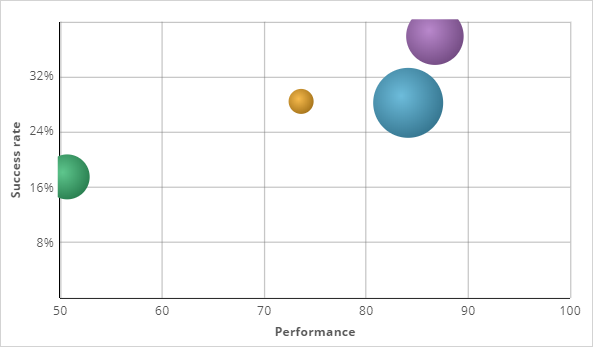
- Notice that for each credit card banner an adaptive model has been created. The performance of the StandardCard model is the lowest, close to 50%. This is correct as the StandardCard receives only random responses.
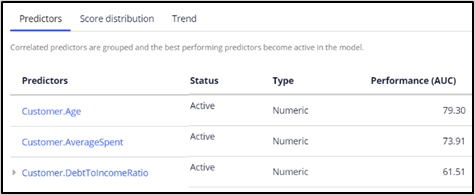
- Scroll down and open the Model report for the RewardsCard.
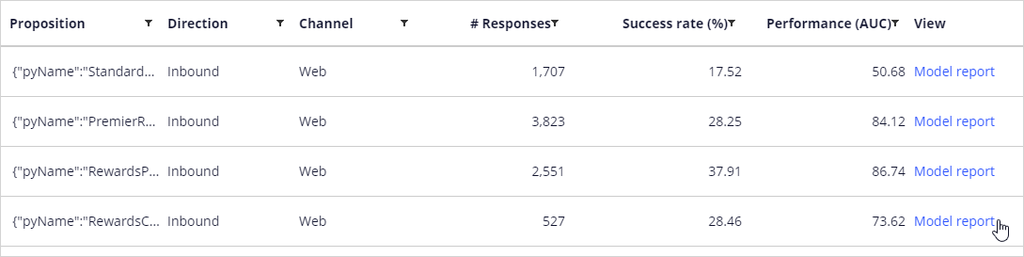
- Notice that the model has identified the Age and AverageSpent customer properties as the predictors with the highest performance. This is correct, as the responses were biased on these properties.
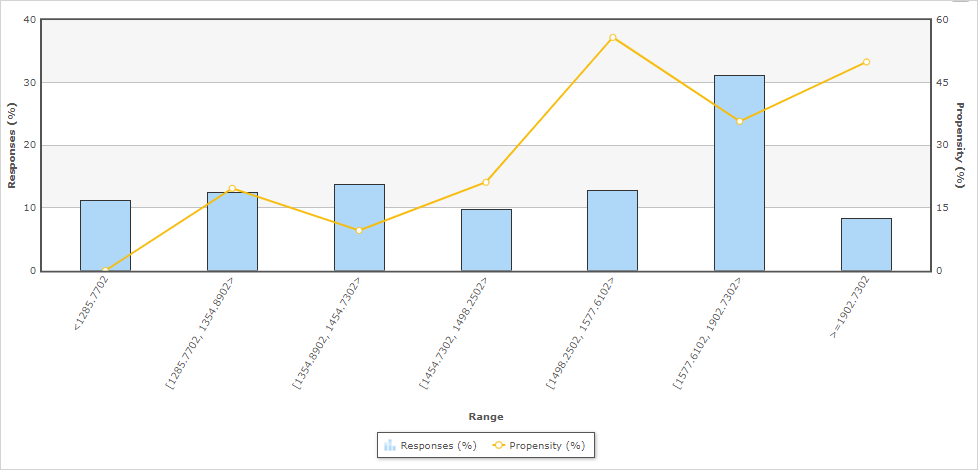
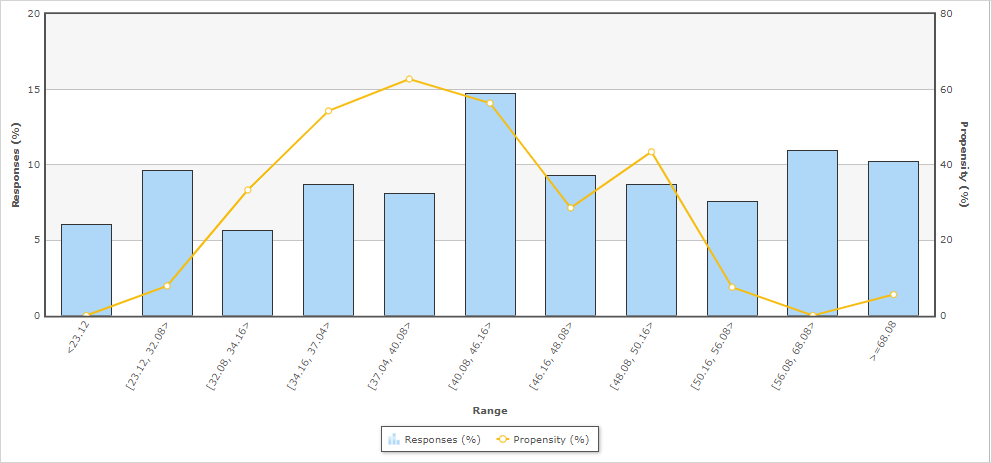
- Click the Customer.Age predictor.
- Notice that the highest customer interest is correctly predicted when they are in late 30s. This demonstrates that the adaptive models have correctly learned from the simulated customer responses.
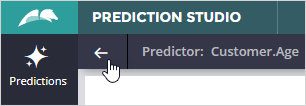
- Return to the Model report.
- Open the Customer.AverageSpent predictor. Notice that customer interest is correctly predicted to increase with higher values for this customer property.