Monitoring adaptive models
3 Tasks
10 mins
Scenario
The models for the U+Bank implementation of cross-selling on the web of their credit cards have been learning for some time. Your task in this challenge is to inspect the models and report on which predictors are performing well, and which are not.
Use the following credentials to log in to the exercise system:
| Role | User name | Password |
|---|---|---|
| Data scientist | DataScientist | rules |
Your assignment consists of the following tasks:
Task 1: Inspect the adaptive models
Inspect the adaptive models by answering the following questions:
- Which model requires attention, and what is the performance of this model?
- What is the performance of the two best-performing models?
- What is the performance of the two worst-performing models, and what is their number of responses?
- Which banner is the most successful?
Task 2: Inspect the predictors of the models
Inspect the predictors in the models by answering the following questions:
- Which two predictors have the highest performance across all models?
- Which predictors are not used in any of the models?
Task 3: Inspect a specific adaptive model
Identify the model with the highest performance, then inspect it and answer the following questions:
- What are the top three predictors used in the model?
- Which predictor, which is not currently relevant to the adaptive model, has the highest performance?
- Which age categories show the highest and lowest interest in this banner?
Challenge Walkthrough
Detailed Tasks
1 Inspect the adaptive models
- On the exercise system landing page, click Pega CRM suite. to open Customer Decision Hub.
- Log in as a data scientist:
- In the User name field, enter DataScientist.
- In the Password field, enter rules.
- In the navigation pane of Customer Decision Hub, click Intelligence > Prediction Studio to open Prediction Studio.
- On the Predict Web Propensity tile, click Open prediction to edit the web propensity prediction.
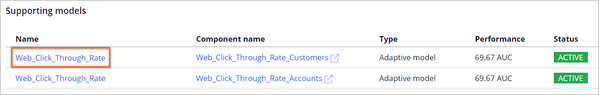
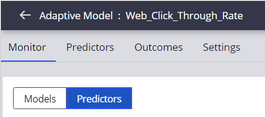
- On the Models tab of the prediction, in the Supporting models section, click Web_Click Through_Rate to open the adaptive model configuration.
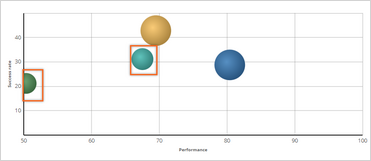
- On the Monitor > Models tab, inspect the bubble chart.
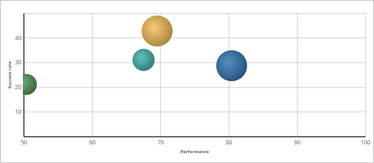 Note: In this web scenario, the success rate of the model is the click-through rate, the fraction of customers that clicks on the banner. The performance is measured as Area Under the Curve (AUC) and has a value in the range of 50 to 100.
- Question - Which model requires attention, and what is the performance of this model?
- Hover over the green model in the chart.
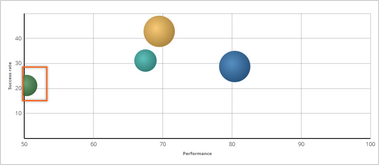 Tip: Note the name of the model and its performance. The StandardCard model with the minimal performance of 50.35 requires immediate attention.
- Hover over the green model in the chart.
- Question - What is the performance of the two best-performing models?
- Hover over the two models in the middle of the chart.
 Tip: The two best-performing models are RewardsPlusCard with a performance of 69,49, and PremierRewardsCard with a performance of 80.40.
- Hover over the two models in the middle of the chart.
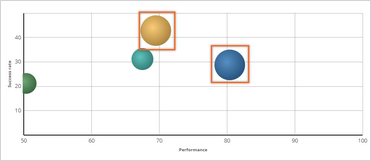
- Question - What is the performance of the two worst-performing models and what is the lowest number of responses?
- Hover over the smallest models in the chart.
 Tip: The RewardsCard and StandardCard models have the worst performances, of 67.51 and 50.35 respectively, and the lowest number of responses of 1550 for each.
- Hover over the smallest models in the chart.
- Question - Which banner is the most successful?
- Hover over the model with the highest success rate in the chart:
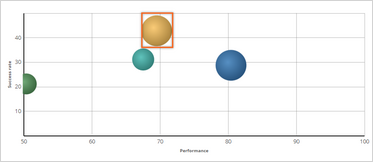 Tip: The RewardsPlusCard has the highest success rate of 42.83%.
- Hover over the model with the highest success rate in the chart:
2 Inspect the predictors of the models
- Question - Which two predictors have the highest average performance across all models?
- Click the Monitor > Predictors tab.
- Click the Average performance column header twice to sort by the average performance.
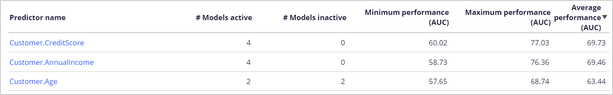 Tip: The two best-performing predictors are CreditScore and AnnuaIIncome. They are used in all 4 models because the # Models inactive value is 0.
- Click the Monitor > Predictors tab.
- Question - Which predictors are not used in any of the models?
- Click the # Models active column header to sort the models in ascending order:
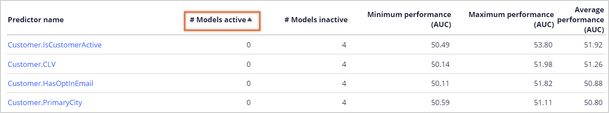 Tip: The predictors with a # Models active value of 0 are currently not used in any of the models.
- Click the # Models active column header to sort the models in ascending order:
3 Inspect a specific adaptive model
- Question - What are the top three predictors used in the model with the best performance?
- Click the Monitor > Models tab.
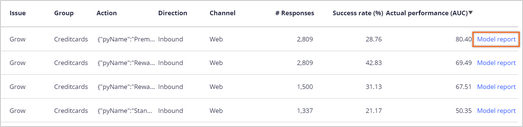
- In the model list, click the Actual Performance (AUC) column header twice to sort the list of models in descending order.
- Click Model report in the first row.
- On the Predictors tab, click the Performance (AUC) column header twice to sort the predictors in descending order.
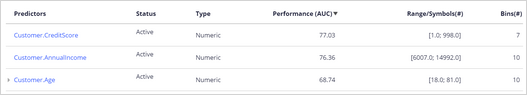 Tip: The top 3 best-performing predictors for this model are CreditScore, AnnualIncome, and Age.
- Question - Which predictor, which is not currently relevant for the adaptive model, has the highest performance?
- Scroll to the bottom of the list.
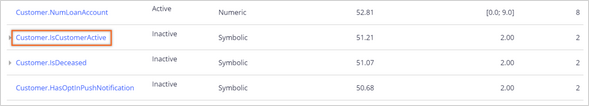 Tip: Customer.IsBankruptcy is the inactive predictor with the highest performance of 51.92.
- Scroll to the bottom of the list.
- Question - Which age categories show the highest and lowest interest in this banner?
- Click the Age predictor.
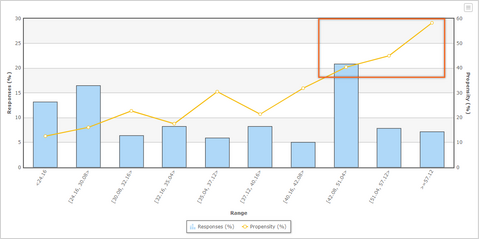 Tip: The highest interest for this banner is in the last bins, with older customers.
- Click the Age predictor.
This Challenge is to practice what you learned in the following Module:
Available in the following mission:
If you are having problems with your training, please review the Pega Academy Support FAQs.
Want to help us improve this content?