
Testing a decision strategy
3 Tasks
25 mins
Scenario
A decision strategy that produces the next-best-label action is set up in the application. The purpose of the decision strategy is to select the label with the lowest printing cost. To implement requirements, the strategy:
- Considers four labels from the Enablement business issue and Labels group.
- Computes the printing cost of each label using the following formula: PrintingCost = BaseCost + 5 * Lettercount.
- Selects only labels with a printing cost that is lower than the average printing cost.
- Uses a decision table to apply the following business rules:
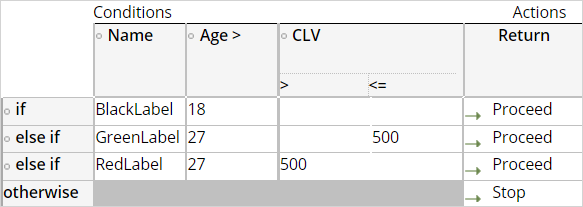
- The Black Label is available for anyone over the age of 18.
- The Green Label is available for anyone over the age of 27 and has a customer lifetime value (CLV) that is under 500.
- The Red Label is available for anyone over the age of 27 and with a CLV that is over 500.
- Uses an adaptive model to predict the likelihood of accepting a given label. The propensity is 0.5 for all labels because the adaptive model is not yet trained.
- Outputs the label with the highest priority, where Priority = Propensity / PrintingCost * 100.
Your task as a Decisioning Architect is to confirm that the output is the next best label and correct the strategy if the output indicates otherwise.
Use the following credentials to log in to the exercise system:
| Role | User name | Password |
|---|---|---|
| Decisioning Architect | DecisioningArchitect | rules |
Your assignment consists of the following tasks:
Task 1: Test the Next-Best-Label strategy with a data transform
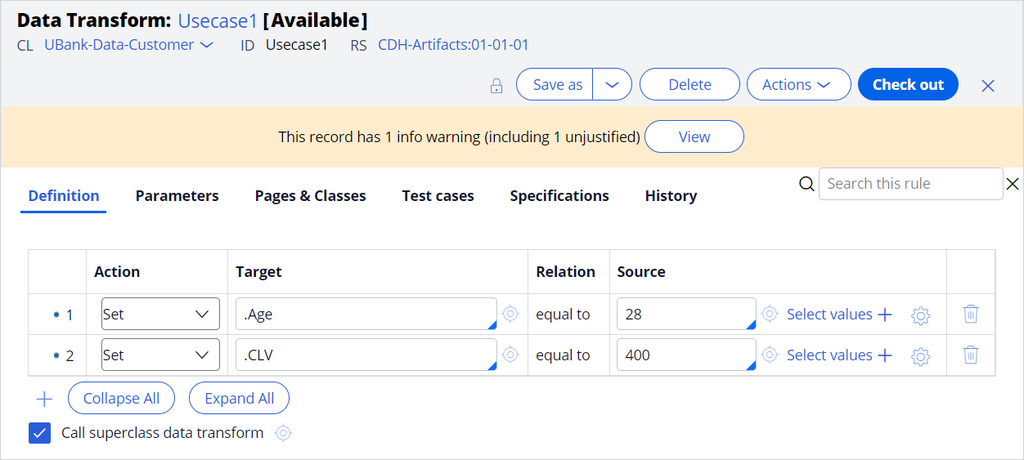
Test the Next-Best-Label strategy by using the UseCase1 data transform.
|
Name |
Age |
CLV |
|
UseCase1 |
28 |
400 |
Confirm that the Strategy Result is not the expected next best label. You can find the printing cost of each label in the following table:
|
Name |
Printing Cost |
|
Blue Label |
85 |
|
Red Label |
70 |
|
Black Label |
70 |
|
Green Label |
60 |
Tip: The strategy is expected to maximize the Priority = Propensity / Printing Cost * 100 expression. The expected result is the Green Label because it has the lowest printing cost and that the propensity to accept is 0.5 for all labels.
Task 2: Identify the cause of the incorrect result and resolve the incorrect result
Select individual strategy components to identify the cause of the incorrect result, and then resolve the problem.
Task 3: Test the NextBestLabel strategy by using a second data transform
Create the Usecase2 data transform, and then run the strategy to get the Red Label as result. Can you explain why?
|
Name |
Age |
CLV |
|
UseCase2 |
50 |
600 |
Tip: In contrast to Usecase1, the CLV value of Usecase2 complies with the Red Label business rule but not with Green Label business rule. The Red Label is selected over the Black Label based on rank.
Challenge Walkthrough
Detailed Tasks
1 Test the Next Best Label strategy with a data transform
- On the exercise system landing page, click Pega CRM suite to log in to Pega Customer Decision Hub™.
- Log in as a data scientist with User name DecisioningArchitect using Password rules.
- In the navigation pane of Customer Decision Hub, click Intelligence > Strategies To open the Strategies landing page.
- On the Strategies landing page, double-click NextBestLabel to open the strategy canvas.
- In the upper-right corner, click Check out.
- On the right, expand the Test pane.
- On the canvas, double-click to adjust the view.
- In the Test run pane, on the Single case tab, expand the Settings section.
- In the Settings section, in the Data transform field, enter or select Usecase1.
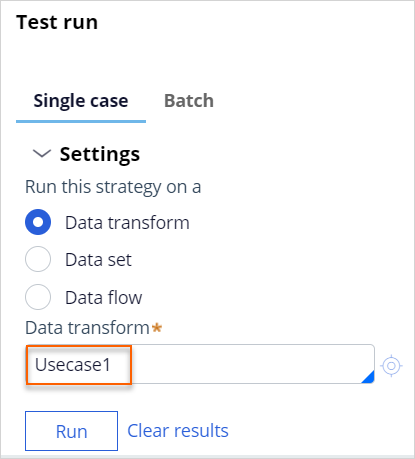
- To the right of the Data transform field, click the Open icon to edit the Usecase1 data transform to observe the values.
- Close the data transform to return to the strategy.
- On the Test run pane, click Save & Run.
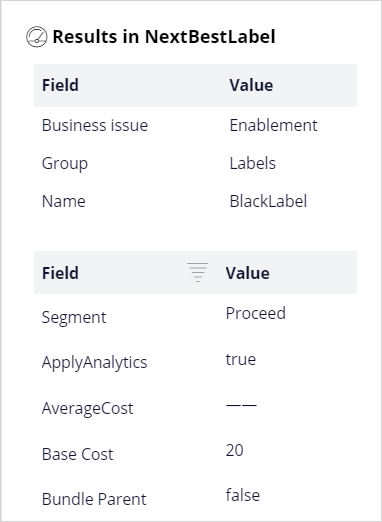
- On the canvas, click the Results component, and then in the results pane, confirm that the NextBestLabel strategy is incorrect.
Note: The result is incorrect because both the Black Label and the Green label actions follow the business rules. The printing cost of the Green Label is lower than that of the Black Label; the propensity to accept is 0.5 for both labels.
2 Identify the cause of the incorrect result and resolve the problem
- On the canvas, open the properties dialog box of the Set Printing Cost component, and then confirm that the PrintingCost action is set in the Define action, target, and source section.
- Close the Set Printing Cost component.
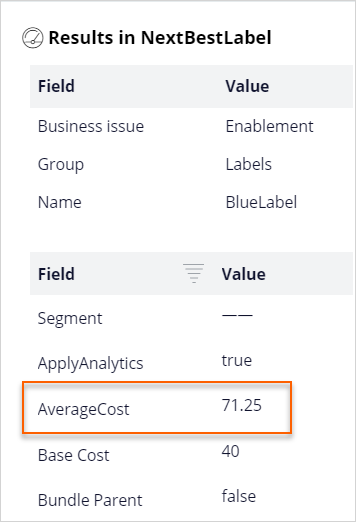
- On the canvas, select the Average Printing Cost group by component.
- In the results pane, confirm that the .AverageCost of the four actions is computed and available.
Note: The results contain only a single page because the Group by component combines all actions in a single row.
- On the canvas, select the Below Average filter component, and then confirm that the component contains three actions. Check which action is missing.
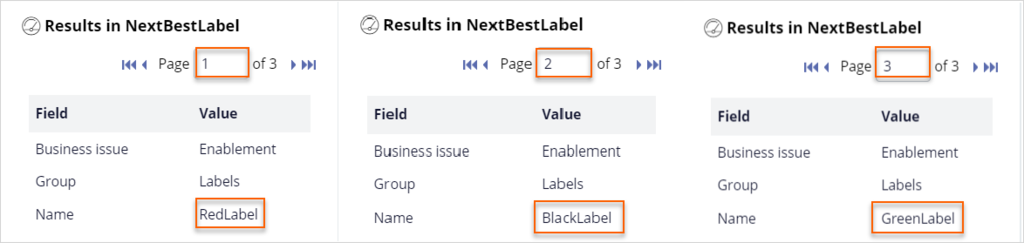
- In the results pane, check that the remaining actions have a PrintingCost that is lower than the AverageCost which is referenced from the Group by component.
- On the canvas, confirm that AverageCost is not propagated by the filter component and is only referenced.
- On the canvas, right-click the Business Rules component, and then select open the Decision Table and evaluate the result for RedLabel for the current case.
Note: What do you expect the result to be, Stop or Proceed? The segment of the RedLabel is Stop as it is inapplicable to Usecase1.
- Close the decision table.
- On the canvas, select the Business Rules component, and then, in the result pane, confirm that a Segment output is available and properly computed for all three labels.

- On the canvas, select the Segment Proceed filter component, and then, in the results pane, confirm that this action is filtered out and that the component contains the remaining two actions.
- On the canvas, select the Propensity to Accept component, and then, in the results pane, confirm that a propensity value is generated for both actions.
Note: The Adaptive model is not yet trained, so the propensity is 0.5 for both actions.
- On the canvas, right-click the Set Priority component, and then select Properties.
- In the Source field, click the Gear icon to open the Expression builder.
- In the Expression builder, click the Test tab.
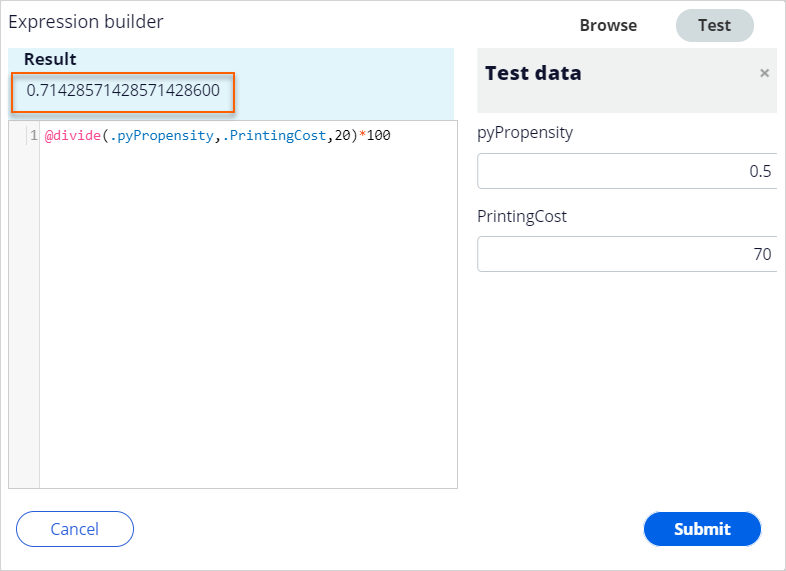
- On the Test tab, in the pyPropensity field, enter 0.5
- In the PrintingCost field, enter 70.
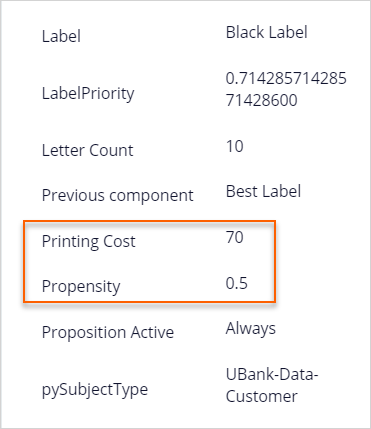
- Click outside the field, and then confirm that the Result is 0.71428571428571428600.
- Optional: Test the formula with other values for the propensity and the printing cost.
Note: Notice that a high priority is correlated with a low printing cost and a high propensity to accept.
- Click Cancel to close the Expression builder.
- Close the Set properties dialog box to return to the strategy canvas.
- On the canvas, select the Set Priority component, and then, in the results pane, confirm that the LabelPriority values of the two actions: 0.71 and 0.83 in the Results section.
- On the canvas, select the Best Label component, and then, in the results pane, confirm that the component outputs the Black Label with a 0.71 priority instead of the Green Label with a 0.83 priority.
- Open the properties of the Best Label component, and then, confirm that the component currently selects the Top 1 label, which is correct, but it incorrectly ranks the labels with a low priority first.
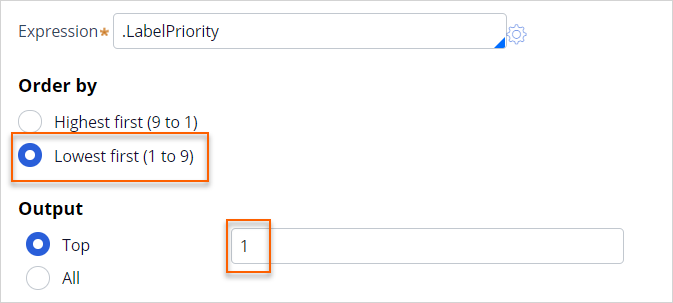
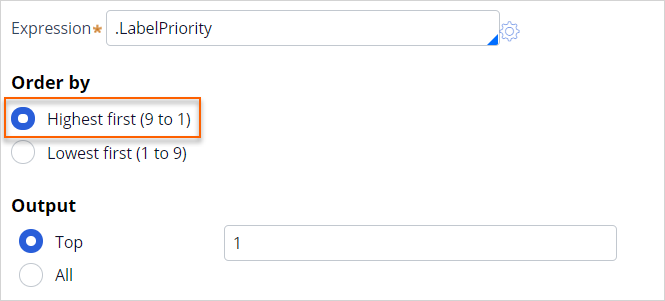
- Select Highest first, and then click Submit to correct the ranking order.
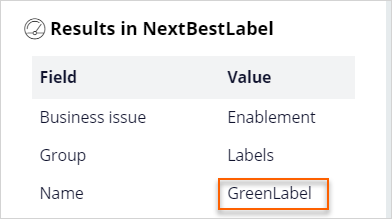
- On the canvas, expand the Test run pane, and then click Save & Run to view the results of the test.
- Confirm that result of the NextBestLabel strategy is the GreenLabel, which is the correct result.
3 Test the NextBestLabel strategy by using a second data transform
- In the Test run pane, on the Data transform field, click the Open icon to open the data transform.
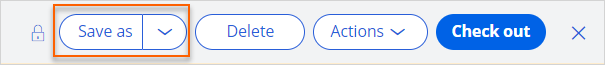
- In the header of the data transform, click Save as to configure the data transform record.
- In the text box field, enter UseCase2.
- In case there is a Development branch, ensure No branch is selected.
- Click Create and open to create the data transform.
- Click Check out to edit the data transform.
- In the Source column of the .Age target enter 50 a
- In the Source column of the .CLV target, enter 600.
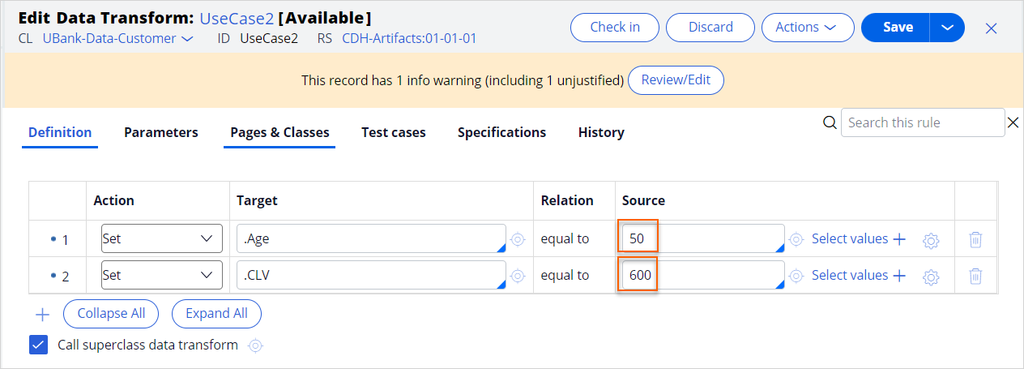
- Click Save, and then close the data transform.
- In the Test run pane, in the Data transform field, enter or select UseCase2, and then click Save & Run.
- Notice the result of the NextBestLabel strategy for UseCase2 and explain the results.
Tip: Both the Black Label and the Red Label are applicable for UseCase2 and both have a printing cost of 70. The strategy selects the Red Label because it has the highest rank as determined by the very first ranking of the SR results set in the Set Printing Cost component.
This Challenge is to practice what you learned in the following Module:
Available in the following missions:
If you are having problems with your training, please review the Pega Academy Support FAQs.
Want to help us improve this content?