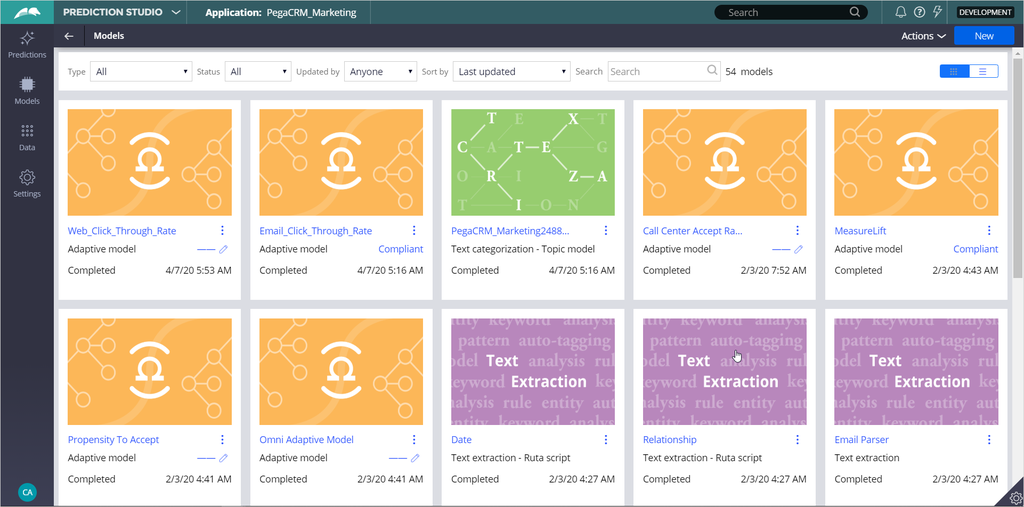
Inspecting adaptive models
Introduction
The predictive performance and success rate of individual adaptive models provide information that can help business users and decisioning consultants to refine the Next-Best-Actions of the company. Monitoring of the health of adaptive models and their predictors is a regular data scientist task that can be performed in Prediction Studio.
Video
Transcript
This demo will show how to inspect the health of your adaptive models and their predictors. This is a regular data scientist task.
The predictive performance and success rate of individual adaptive models provide information that can help business users and decisioning consultants to refine the Next-Best-Actions of the company.
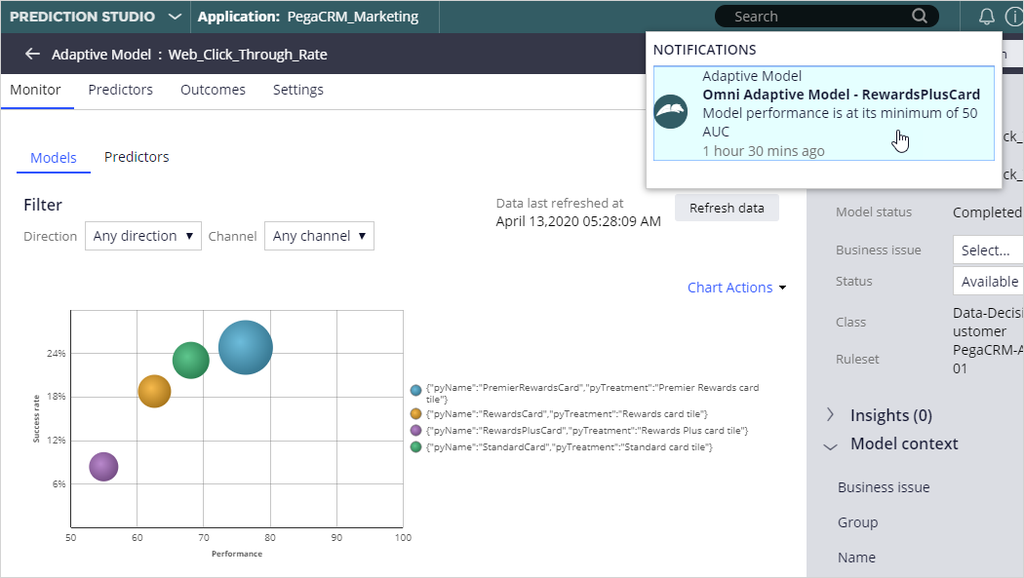
We will inspect the Web_Click_Through_Rate model, that calculates the propensity that a customer will respond positively to an offer made on the web channel.
The Monitor tab of an adaptive model configuration shows a bubble chart that visualizes the key metrics of all models generated.
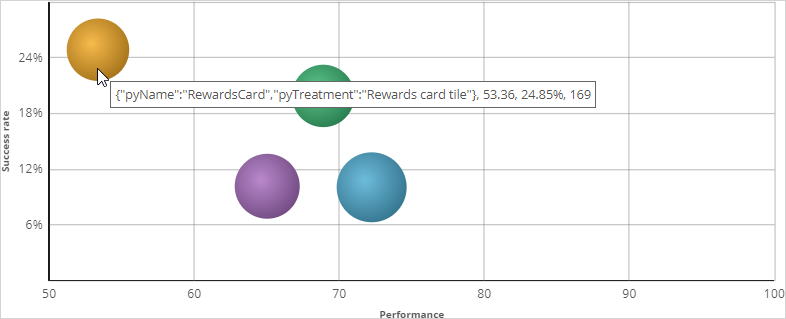
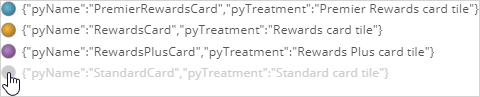
Each bubble represents the model for a specific action.
The size of a bubble indicates the number of responses (positive and negative) to that action that have been used in the adaptive learning process.
In this example, there is a model for every action belonging to the Credit Card group.
When you hover the cursor over a bubble, you can view the name of the action, the performance, the success rate, and the number of responses.
In the legend, display of models can be toggled on and off.
The Performance axis indicates the accuracy of the outcome prediction.
The model performance is expressed in the Area Under the Curve (AUC) unit of measurement, which has a range between 50 and 100.
The higher the AUC, the better a model is at predicting the outcome.
The Success rate axis indicates the success rate expressed in percentages.
In this example, the success rate represents how often a web banner is clicked.
The system calculates this rate by dividing the number of times a banner is clicked by the total number of times the banner was shown on the website.
The information you see here is extracted from the Adaptive Data Mart, which is a reporting view of the Adaptive Decision Manager (ADM) server.
The Adaptive Data Mart is built automatically by a process running in the background. This process creates snapshots at regular time intervals.
This means that the data as reported may not be the same as the data you see when you view it in real-time. You can refresh the view to synchronize the data.
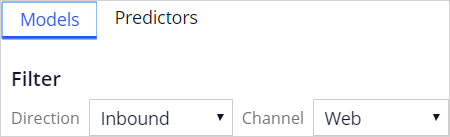
The model context includes the channel and direction, so you have different models for the Call Center, Email and Web channels, as well as for the inbound and outbound directions.
You can apply filtering to focus on models for a particular direction or channel, or a combination of the two.
Actionable insights are generated for individual models when the number of responses, model performance or success rate significantly changes over time.
On the Predictors tab, the number of models in which a predictor is active, and the performance of the predictor is displayed.
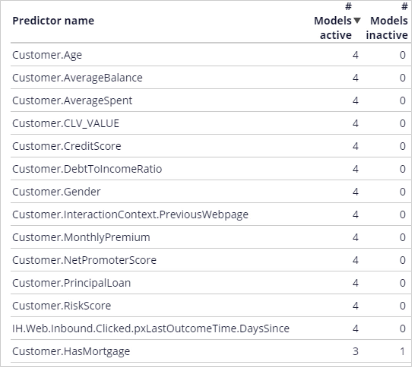
In this case, the Age predictor is used in all four models.
The HasMorgtage predictor is active in three models and inactive in one model, where its predictive power is below the threshold.
The default value for this threshold is 52 percent.
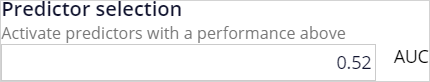
The system continuously monitors the predicting power of every predictor. If the predicting power of a predictor drops below the threshold value that predictor is deactivated.
The data that is used to visualize the models in the bubble chart is displayed in a table below the chart.
For each model number of responses, success rate and performance are shown.
From the adaptive model table, you can drill down into a model report for a specific adaptive model.
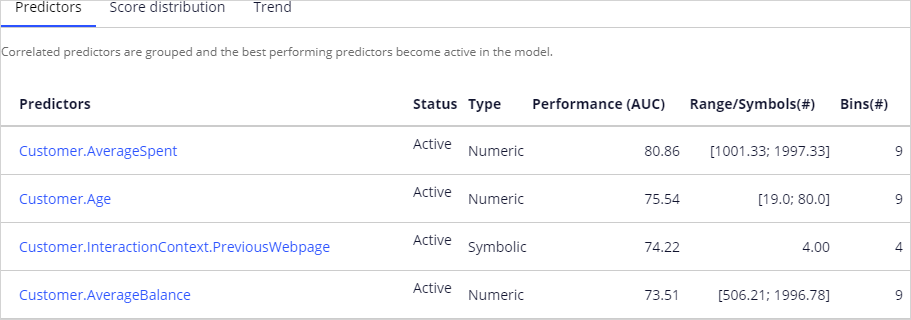
There are three tabs, reporting on predictors, the model score distribution and the trend. In the predictors report, you can examine the performance of individual predictors.
Let’s examine a couple of them.
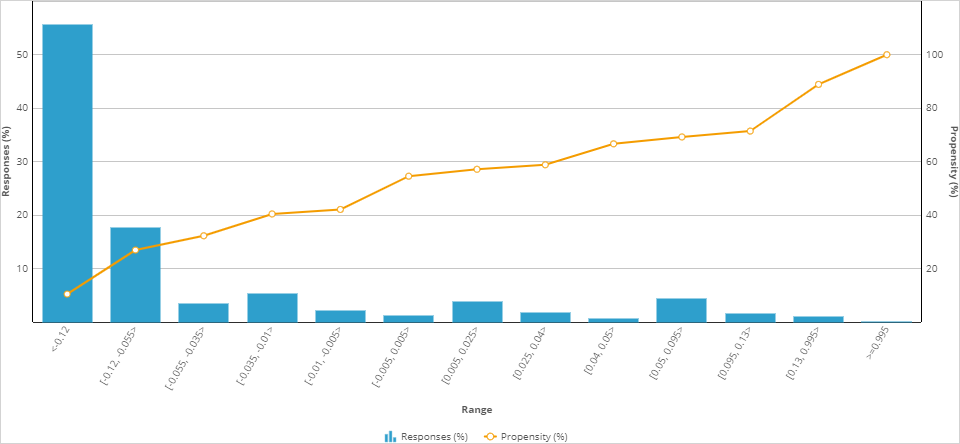
In this case, the best performing predictor is AverageSpent. This a predictor of type numeric.
The system split the AverageSpent predictor into 9 bins. Each bin has its own offer propensity.
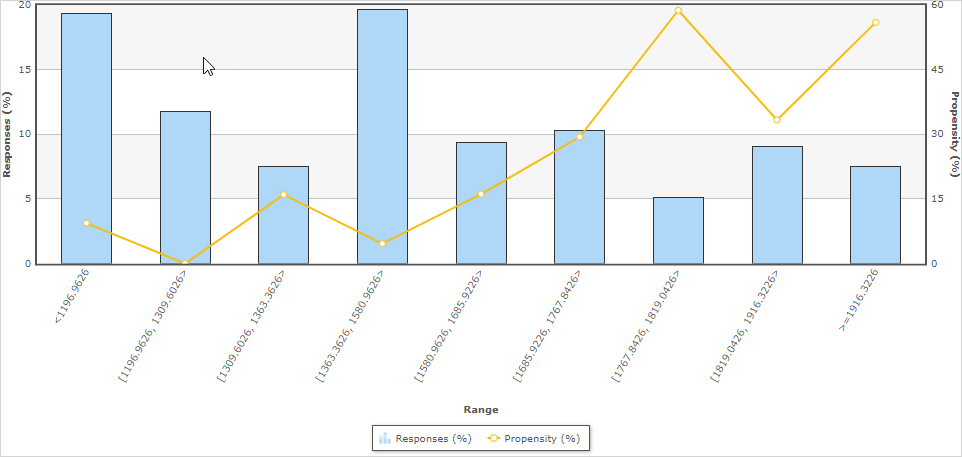
Propensity is the likelihood of positive customer behavior, which in this example is clicking on a web banner.
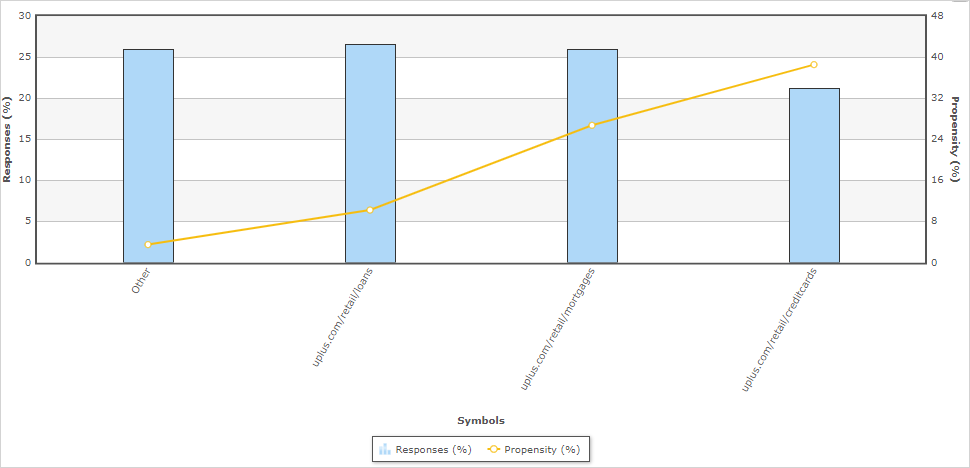
Now, let’s examine the symbolic PreviousWebpage predictor.
The system split this predictor into 4 bins. The context of an interaction, in this case the previous web page visited by the customer, can be highly predictive.
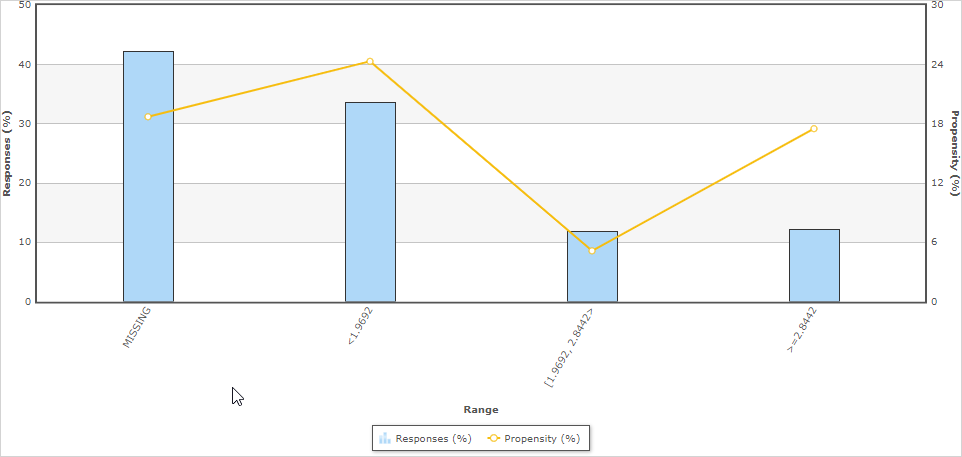
To further improve the predictive power of the models the system uses Interaction History summaries.
In this example, the adaptive system established that the number of days since the offer was accepted is a well-performing predictor.
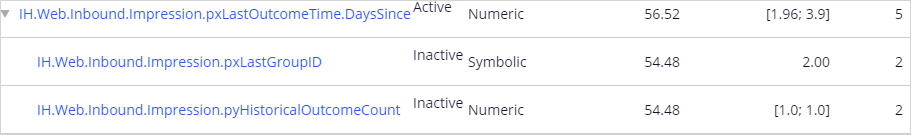
The system grouped three predictors that are correlated. It then marked two of them as inactive. Inactive predictors are not used in the propensity calculation.
The Score distribution report enables you to examine the propensity distribution for the whole model.
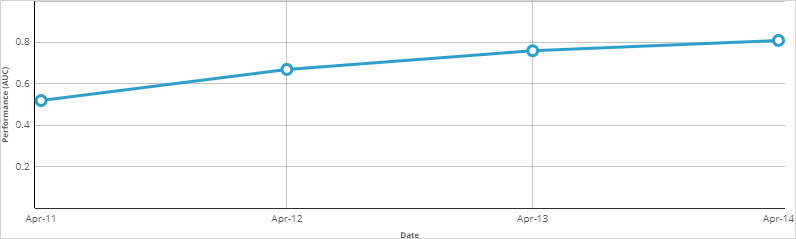
And in the trend report you can see the performance of the model over time.
This demo has concluded. What did it show you?
- How the key metrics of adaptive models are visualized in a bubble chart.
- How you can customize the bubble chart by filtering.
- How to inspect active and inactive predictors.
- How to inspect individual predictors.
- How predictors with similar predictive performance are grouped.
- How to examine the propensity distribution for the whole model.
- How to examine the trend for the whole model.
This Topic is available in the following Modules:
If you are having problems with your training, please review the Pega Academy Support FAQs.
Want to help us improve this content?