The Report Browser
You use the Report Browser tool to create new reports, organize, run, and share reports as well as manage report categories. Pega Platform™ organizes reports by category. A category defines an organizational framework for reports displayed in the Report Browser. Each category consists of a label and an owner type that exposes the category to a specific audience: an individual user, a group of users, or all users. The two types of categories are private and public.
- Private categories provide shortcuts to reports that you create. Other users cannot run or view these reports.
- Public categories provide shortcuts to standard Pega out-of-the-box reports that provide deep insight around the volume, process, and efficiency for case resolution as well as reports that users made available to others. Typically, application developers determine which standard reports are available to all users of an application.
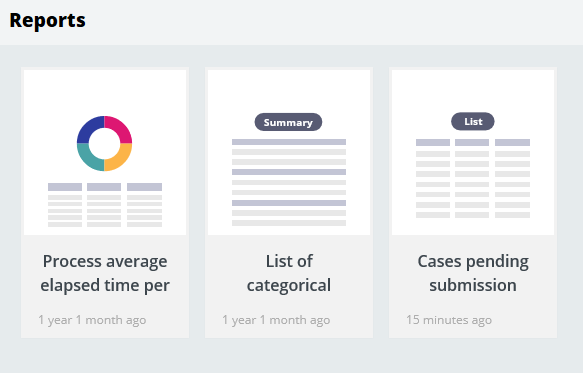
The Report Browser displays reports as visual tiles that provide a preview of the type of report. The first row of tiles shows reports recently open by the user. Each tile includes a time period. The time period listed on each tile indicates the amount of time elapsed since the report's creation. In the following example, the Report Browser shows three reports recently opened by the user.
From the Report Browser, you can choose between viewing all available reports or the reports you create. You can also alternate between tile and list views. In addition, you can perform text- and category-based searches.
Standard Pega Public report categories
Pega Platform populates and sorts standard reports into the following Public categories.
Reports in the Analyze Performance category analyze and summarize resolved (completed) work items along quality dimensions. You can use these reports to review past performance and identify areas that might be improved. For example, the Average Performance Time By Task report contains a bar chart and summary counts of how much time (in hours) that tasks are in processing mode or idle mode as well as the total time it takes users to complete tasks. In the following chart, the Identify location task takes six hours to complete. A stakeholder may use this information to investigate why the Identify location task takes longer than the others, find ways to shorten the task duration, and improve process performance.

Reports in the Analyze Quality category identify, by assignment, which actions were selected, how often, and the timeliness of the selection. For example, the Number of items resolved daily by work type illustrates the pace at which a work group completes tasks. In the following example, Work group1 resolves 20 items on August 27 and 30 items on August 28. Work group2 resolves 10 items on August 27 and 20 items on August 28.

Reports in the Case Metrics category provide information about open and resolved cases, and historical views of step performance. Two reports are in the case metrics category — Time per stage and Case Volume. The Time per stage report provides a stacked bar chart of resolved cases by stage with the length of the bar representing the length of time spent in each status by work type.
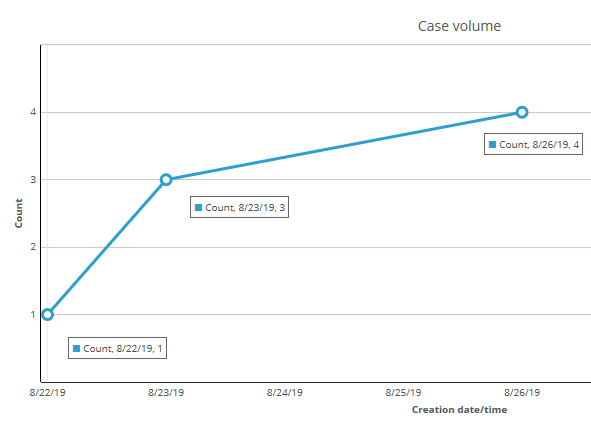
The Case Volume report provides the cases created per day grouped by case types for the last seven days. The report in the following example indicates one new case on August 22, three new cases on August 23, and four new cases on August 26.
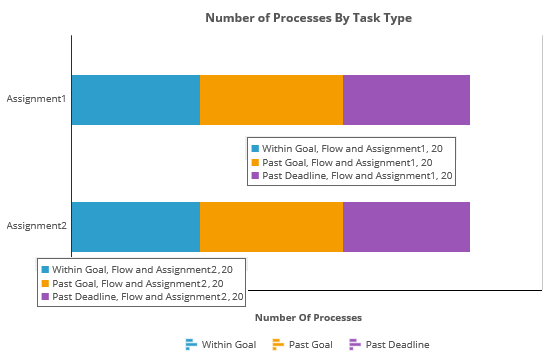
Reports in the Monitor Assignments category provide information about open assignments. For example, the Timeliness by Task report shows a horizontal bar chart with bars corresponding to the names of assignment tasks. Counts and colors show how many assignments (for users in your work group) of each task are Within Goal, Past Goal, and Past Deadline. In the following example, for Assignment1, 20 assignments are within goal, 20 assignments are past goal, and 20 assignments are past deadline. For Assignment2, 20 assignments are within goal, 20 assignments are past goal, and 20 assignments are past deadline.
Reports in the Monitor Processes category list or summarize open (unresolved) work items in the current application. These reports support day-to-day monitoring of the business processes that are supported by your application. For example, the List of Processes Resolved by the Current Operator provides users with a list of all the cases they resolved. The report is filtered to show all resolved cases, but users can edit the report to change the time period filter.

Reports in the Open Cases provide the case-level service level agreement (SLA) status for open cases.
Reports in the Service Level Performance category provide the assignment SLA statuses. The User Timeliness report groups the assignment SLA statuses by user. The open Step Timeliness report groups the assignment SLA statuses by step.
Reports in the Step Performance category provide the status of process steps. The Step Performance category includes the following reports.
- Goals and deadlines by step – Provides the SLA status grouped by assignment.
- Step duration – Provides a historical view of the time it took a user to complete a step.
- Time spent in step – Provides a historical view of the time spent on a particular step.
Reports in the Predictive Model Monitoring category provide performance information of your predictive models.
Note: To learn more about predictive model monitoring, see Predictive models monitoring.
This Topic is available in the following Module:
If you are having problems with your training, please review the Pega Academy Support FAQs.
Want to help us improve this content?