The Tracer
The Tracer is a tool available in the Pega Platform™ that helps you with troubleshooting. When an error occurs in an application, you must identify the source. By viewing the events that led to the error, you can find the root cause and fix the issue.
For example, a declare Expression that is used to set a property value may return an unexpected value. This property value is used to determine whether a particular workflow Stage should be skipped. The user notices that the Case advances to an unexpected Stage and finds that the declare Expression property is not displayed in the UI. The Tracer tool documents the sequence of execution events allowing the user to troubleshoot this error.
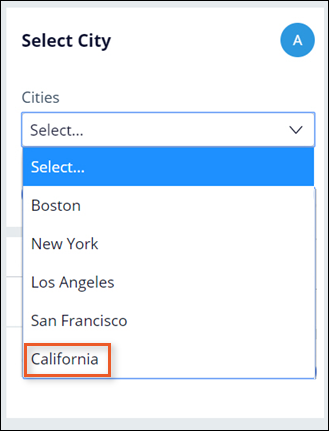
In another example, your application uses a Data Page to populate a drop-down list of cities. If the contents of the drop-down list are incorrect, you need to determine whether the control or the connection to the data source has an improper configuration.
In the following image, the drop-down list includes a state in a list of cities:
The Tracer tool versus the Clipboard tool
As your application executes, Pega Platform logs all the processing events that result from application execution. Unlike the Clipboard tool, which presents the current value of properties in memory, the Tracer provides a complete log of the events that occur during Case processing. This log allows you to identify the source of execution errors, such as Java exceptions or incorrect property values.
In the center of the following image, slide the vertical line to compare the Clipboard tool and Tracer tool:
Caution: Running the Tracer impacts application performance significantly due to the volume of data collected for Rule execution. As a best practice, do not use the Tracer as a performance analysis tool. To learn more about using the Tracer, see Tracer best practices.
Identify errors in Case processing
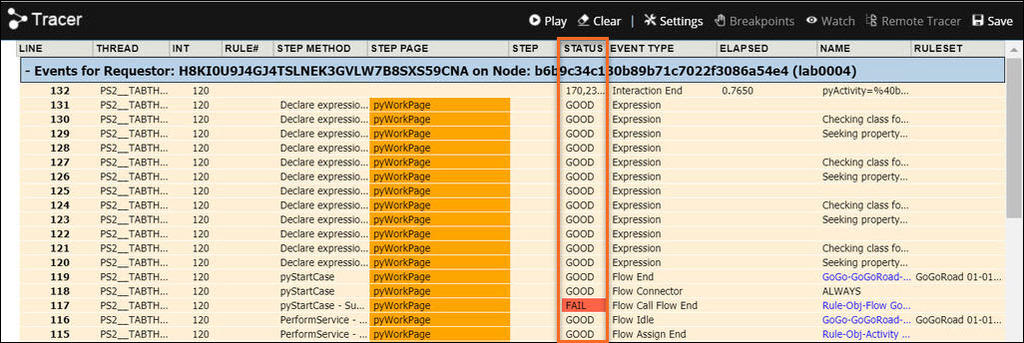
To help identify errors in Case processing, the Tracer identifies processing Steps in which an error has occurred. The Status column in the Tracer log helps you identify the processing Steps that lead to an error. In the Tracer log, most Steps return a status of Good, indicating that the Step completed successfully. If a Step returns a status of Fail, an error occurred, and the Step completed unsuccessfully.
The following image shows the Tracer tool displaying a failed Step:
An error in an application may only indicate the last Step in a sequence of failed Steps but not the cause of the fail sequence. Reviewing the sequence of events in the Tracer helps identify the root cause that leads to the error seen by users.
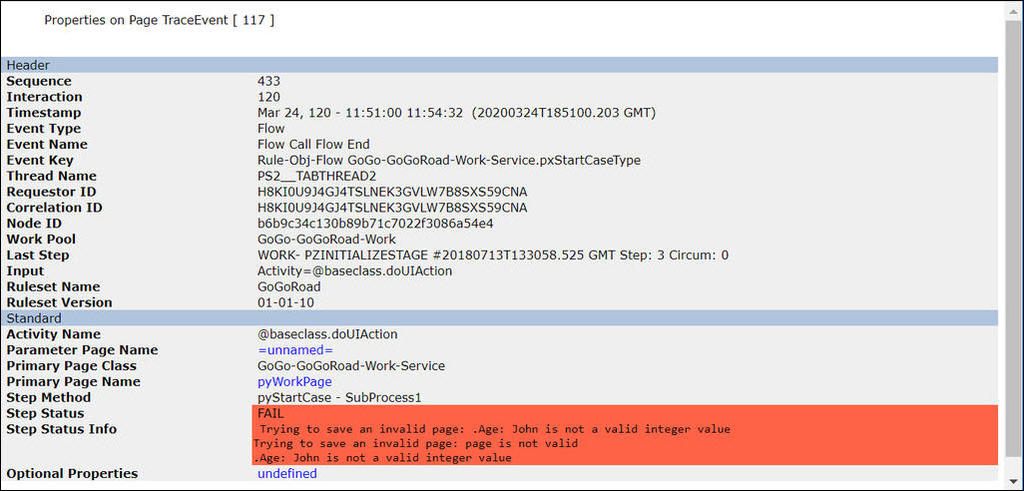
In the Tracer tool, when you click on the failed Step, the properties for that event are displayed. The following image shows the properties in a failed Step:
Note: To learn more about identifying the root cause of errors, see Tracing and capturing events.
Check your knowledge with the following interaction:
This Topic is available in the following Module:
If you are having problems with your training, please review the Pega Academy Support FAQs.
Want to help us improve this content?