Analyzing customer distribution using Pega Value Finder
3 Tasks
10 mins
Scenario
U+ Bank is currently doing cross-sell on the web by showing various credit cards to its customers.
They want to run a value finder simulation to check if there are any under engaged customers and customer with no actions to serve them better.
Use the following credentials to log in to the exercise system:
|
Role |
User name |
Password |
|---|---|---|
|
Decisioning Analyst |
CDHAnalyst |
rules |
Your assignment consists of the following tasks:
Task 1: Prepare data set for simulation run
Run the PrepareSampledCustomers_REF data flow to prepare the data set for the simulation run.
Note: The Sampled Customers is not available in a persisted store. To initialize the customer data, first run the PrepareSampledCustomers_REF data flow.
Task 2: Create and execute a value finder simulation
Create and execute a value finder simulation for the Sales issue and Creditcards group. Use the Sampled Customers data set as the audience.
Task 3: Inspect the simulation results
Inspect the result of the simulation by answering the following questions.
- How many customers are under-served due to the eligibility conditions?
- What percentage of customers are well-served in the first Customer group from the Under-served customers after eligibility category?
- How many customers are left without actions after every engagement policy condition is applied?
Challenge Walkthrough
Detailed Tasks
1 Prepare data set for simulation run
- Log in as Decisioning Analyst with username CDHAnalyst and password rules.
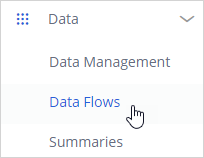
- In the navigation pane of Pega Customer Decision Hub, click Data > Data Flows.
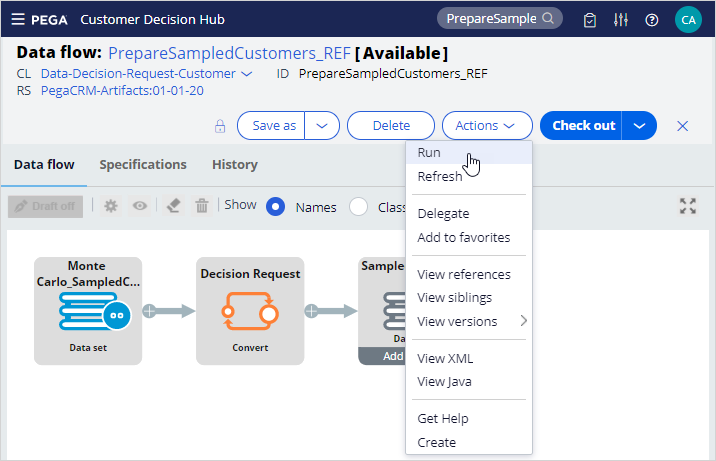
- Search for and then open the PrepareSampledCustomers_REF data flow to prepare the data set used for simulations. This data is based on a Monte Carlo dataset, which is generated.
Note: The Monte Carlo data set generates a mock data set. As a result, different simulation runs have different results.
- Click Actions > Run.
- Click Submit.
- Click Start.
Note: Notice that the prospect data is populated once the test run is complete.
- Close the data flow Test run window.
2 Create and execute a value finder simulation
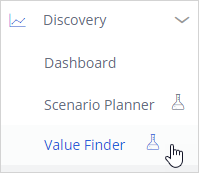
- In the navigation pane of Pega Customer Decision Hub, click Discovery > Value Finder.
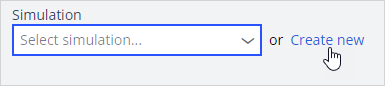
- Click Create new to create a new value finder simulation.
- In the Create simulation dialog box, configure the following information.
- Find opportunities for: Issue: Sales and Group: Creditcards
- Audience: Sampled Customers
- Simulation ID prefix: Value Finder
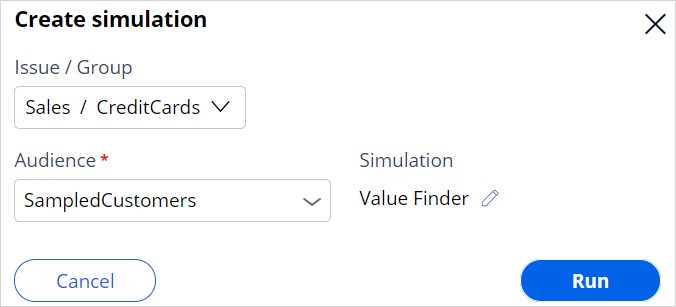
- Click Run to execute the simulation. Once the run is complete, the results are displayed.
Note: The Monte Carlo data set generates a mock data set. Therefore, different simulation runs will have different results.
3 Inspect the simulation results
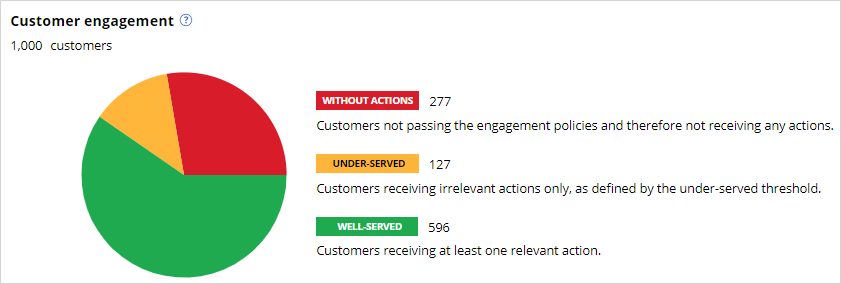
- Note the number of Without actions, Under-served, and Well-served customer distribution in the pie chart.
Question: How many customers are under-served due to the eligibility conditions? - Scroll down to note the Top opportunities are identified by the system for the current engagement policy conditions configured.
Note: The top opportunities help you identify at what stage the customers are filtered out from receiving an action.
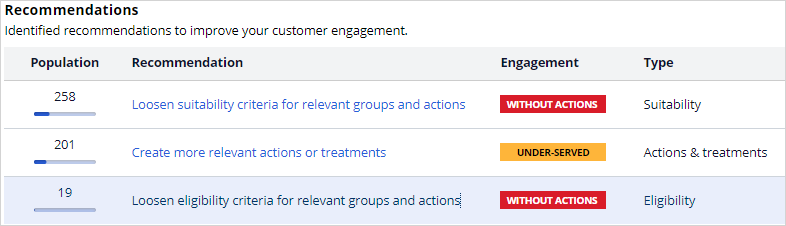 Tip: 19 customers are under-served due to eligibility conditions.
 - Click Create more relevant actions and treatments to view more details.
Question: What percentage of customers are well-served in the first Customer group from the Under-served customers after eligibility category? - In the Create more relevant actions or treatments pop-up window, inspect the information to understand the recommendation and the top discovered customer groups identified by the system. Note the number of customers filtered-out per customer group.
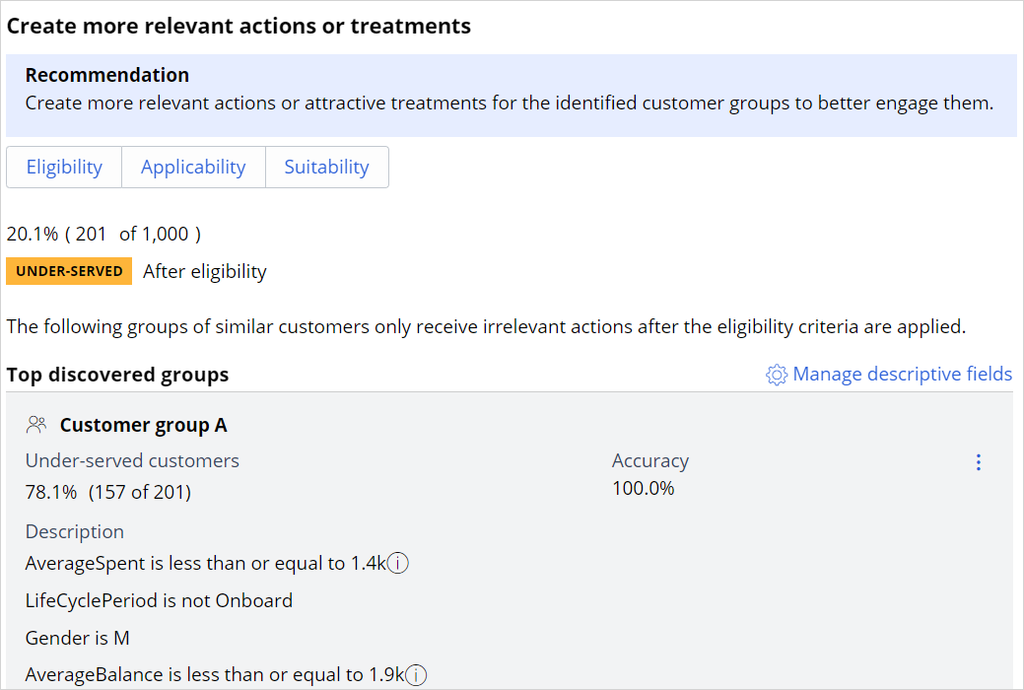 Tip: The accuracy of the first customer group “A” is 100%. Hence the percentagr of well-served customers in group A is 100 - 100 = 0%.
 - On the right, click Manage Descriptive fields to view the fields used by the system to categorize the customers into different groups.

Question: How many customers are left without actions after every engagement policy condition is applied? - Close the pop-up window.
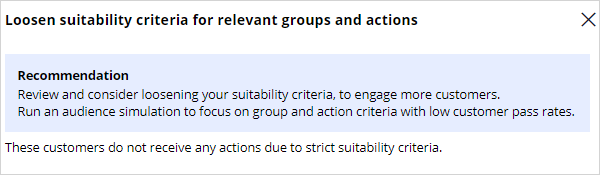
- Click Loosen Suitability criteria for relevant groups and actions to view the second top opportunity recommendations of the system.
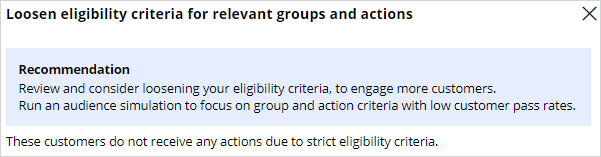
- Click Loosen Eligibility criteria for relevant groups and actions to view the second top opportunity recommendations of the system.
This Challenge is to practice what you learned in the following Module:
Available in the following mission:
If you are having problems with your training, please review the Pega Academy Support FAQs.
Want to help us improve this content?