
Configuring a dashboard
2 Tasks
30 mins
Scenario
Stakeholders have seen growth in the use of the Assistance request application. They want to confirm that, even though Cases are increasing, they are still being resolved quickly. The stakeholders have asked to see the number and status of Assistance Request Cases that have been added over the last 30 days on the Web Portal's Work metrics dashboard.
Note: The framework of this challenge uses the Constellation architecture of Pega Platform™. To practice this challenge on the Traditional UI architecture, see the Configuring a dashboard version 8.8 challenge.
The following table provides the credentials you need to complete the challenge:
| Role | User name | Password |
|---|---|---|
| Application Developer | author@gogoroad | pega123! |
Note: Your practice environment may support the completion of multiple challenges. As a result, the configuration shown in the challenge walkthrough may not match your environment exactly.
Challenge Walkthrough
Detailed Tasks
1 Add an Insight to the Work metrics dashboard
- In the Pega instance for the challenge, enter the following credentials:
- In the User name field, enter author@gogoroad.
- In the Password field, enter pega123!.
- In the header of App Studio, click Preview.
- In the header of App Studio, confirm that you are on the Web Portal.
- In the navigation pane of the application, click Dashboards to open the Dashboards widget.

- In the Dashboards table, click Work metrics to open the Work metrics dashboard.
- In the upper-right corner, click Edit to personalize the dashboard.
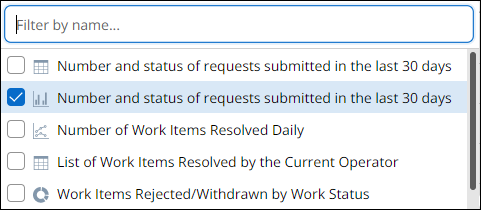
- On the right, in the Dashboard pane, in the Region A section, click Add to display a dialog with Insights.
- Select the Number and status of requests submitted in the last 30 days checkbox with the chart icon, and then click Add.
- To the left of the Number and status of requests submitted in the last 30 days widget, click the handle, and then drag the widget to the top position in Region A.
2 Switch the dashboard template
- In the upper-right of the Dashboard pane, click Edit to display the Edit template window.
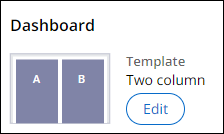
- In the Edit template window, click Wide-narrow, and then click Submit.
- Confirm that all dashboard widgets in Region A are wider than the widgets in Region B.
- In the upper-right of the Work metrics dashboard, click Save dashboard to finish personalizing the dashboard.
Confirm your work
- Create several Assistance Request Cases, and then advance the Cases to a variety of Stages and Steps to generate data for the Insight.
- In the navigation pane, click Dashboards, and then click Work metrics to return to the Work metrics dashboard.
- Confirm that the Number and status of requests submitted in the last 30 days Insight displays data.
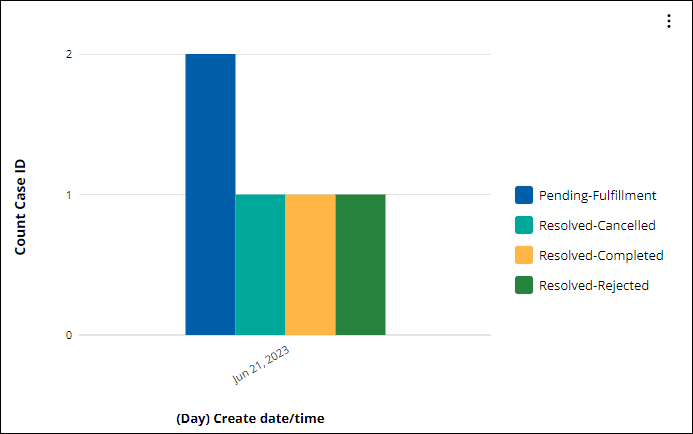 Note: The Insight results displayed on your system might vary from the example.
This Challenge is to practice what you learned in the following Module:
Available in the following missions:
If you are having problems with your training, please review the Pega Academy Support FAQs.
Want to help us improve this content?