Exporting historical data
5 Tasks
15 mins
Scenario
U+ Bank implements Pega Customer Decision Hub™ to display a personalized credit card offer to eligible customers on their website. As a data scientist, you want to export the raw data used by the Web Click Through Rate adaptive model in the production phase of the project, to optimize the click-through rate of the web banners that contain the credit card offers.
Use the following credentials to log in to the exercise system:
| Role | User name | Password |
|---|---|---|
| Data scientist | DataScientist | rules |
Your assignment consists of the following tasks:
Task 1: Configure the recording of historical data
Change the settings of the Web Click Through Rate adaptive model to enable the recording of historical data generated by the model. Set the sample percentage for both positive and negative responses to 100%.
Caution: These sampling percentages are for demonstration purposes only. A web banner typically has a very high number of negative responses, so a very low sampling percentage is appropriate for negative responses while maintaining 100% for the positive responses.
Task 2: Create a data set
Create a new data set and set the Apply To field to UBank-CDH-Data-Customer to set the class. Map the data set to the file in the repository that contains the historical data.
Task 3: Trigger the creation of customer interaction records
On the U+ Bank website, log in multiple times and generate two negative responses by ignoring the banner and one positive response by clicking the banner.
Task 4: Export the data set
In Dev Studio, export the data set. The data set is exported in the JSON format.
Task 5: Examine the JSON file
Examine the file by answering the following questions:
- In the first record, who is the customer, what is the treatment the customer received, and what is the outcome of the interaction?
- How many predictors have a captured value, and how many predictors are configured in the adaptive model of the first record? What explains the difference?
Challenge Walkthrough
Detailed Tasks
1 Configure the recording of historical data
- On the exercise system landing page, click Pega CRM suite to log in to Customer Decision Hub.
- Log in as a data scientist:
- In the User name field, enter DataScientist
- In the Password field, enter rules.
- In the navigation pane of Customer Decision Hub, click Intelligence > Prediction Studio to open Prediction Studio.
- On the Predict Web Propensity tile, click Open prediction to open the prediction.
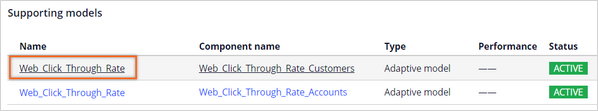
- On the Models tab, in the Supporting models section, click Web_Click_through_Rate to open the model.
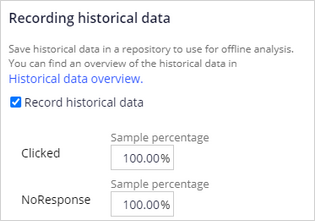
- On the Settings tab, in the Recording historical data section, select the Recording historical data checkbox to set the data as active.
- Set the sample percentage for NoResponse to 100% to record all responses.
 Caution: These sampling percentages are for demonstration purposes only. A web banner typically has a very high number of negative responses, so a very low sampling percentage is appropriate for negative responses while maintaining 100% for the positive responses.
- In the upper-right corner, click Save.
2 Create a data set
- In the navigation pane of Prediction Studio, click Data > Data sets.
- In the upper-right corner, click New to create a new data set.
- Configure the data set with the following information:
- Name: ADMPayload
- Type: File
- Apply to: Ubank-CDH-Data-Customer
- Add to ruleset: CDH-Rules
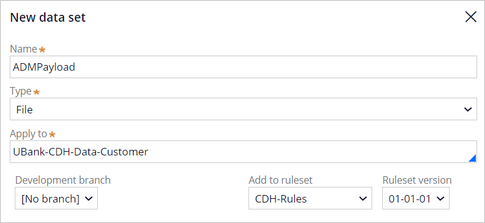
- Click Create to create the data set.
- In the Configuration section, select the CDHData repository.
- In the File path field, set the file path to /ADM/Rule-Decision-AdaptiveModel/Data-Decision-Request-Customer-CDH/Web_Click_Through_Rate/records*.json.
- Click Save.
3 Trigger the creation of customer interaction records
- On the exercise system landing page, click U+ Bank to open the U+ Bank website.
- In the upper-right corner, log in as customer Troy.
- Ignore the offer, and then log out.
- Log in as customer Barbara.
- Ignore the offer, and then log out.
- Log in as customer Joanna.
- On the banner, click Learn more to register a positive response.
4 Export the data set
- Return to Prediction Studio, and in the upper-left corner, switch to Dev Studio.
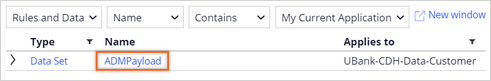
- In the upper-right corner, in the search text box, enter ADMPayload.
- In the search results list, click ADMPayload to open the data set.
- In the upper-right corner, click Actions > Export to open the Export data set dialog box.
- In the Export data set dialog box, click Export.
Note: It might take several minutes to populate the data set. If the number of processed records does not match the number of logins, close the Export data set dialog box, and then retry.
- Click Download file, and then save the data.json file to your local machine.
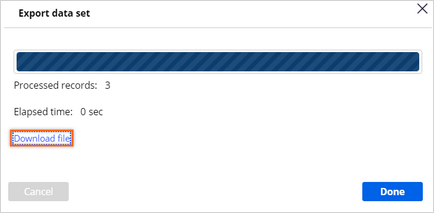
- Click Done to close the dialog box.
- In the upper-left corner, switch to Prediction Studio.
5 Examine the JSON file
- On your local machine, extract the data.json file from the downloaded ZIP file.
- Open the data.json file in a text editor that displays the JSON format correctly.
Tip: There are many options for compatible text editors available on the internet, such as Notepad++.
- Question – In the first record, who is the customer, what is the treatment the customer received, and what is the outcome of the interaction?
- The customer ID is recorded as the Decision_SubjectID property, the treatment is recorded as the Context_Treatment, and the outcome is recorded as the Decision_Outcome property.
- Question – How many predictors have a captured value, and how many predictors are configured in the adaptive model of the first record? What explains the difference?
- In the JSON file, count the predictors for which a value has been recorded.
- In Prediction Studio, in the navigation pane on the left, click Predictions.
- On the Predict Web Propensity tile, click Open prediction to open the prediction.
- On the Models tab, in the Supporting models section, click Web_Click_through_Rate to open the model.
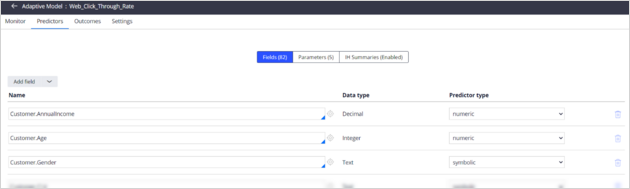
- On the Predictors tab, note the number of configured fields.
Tip: The number of predictors for which a value is recorded is lower than the number of potential predictors configured in the model. The model activates only predictors that perform above the threshold configured on the Settings tab.
Available in the following mission:
If you are having problems with your training, please review the Pega Academy Support FAQs.
Want to help us improve this content?