Analyzing customer distribution using Pega Value Finder
A Value Finder simulation allows you to engage more empathetically with customers by identifying and profiling “under-served” customers. The business can analyze the Value Finder results to adjust engagement policies or create new actions and treatments.
Video
Transcript
This demo shows you how to analyze customer distribution by using a Pega Value Finder simulation.
U+, a retail bank, has recently implemented a project in which credit card offers are presented to qualified customers when they log in to the self-service web portal. The bank wants to check if there are any unserved or underserved customers and find ways to serve them better.
This is the Pega Customer Decision Hub™ portal.
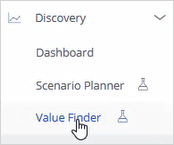
In Discovery, you can create a new Value Finder simulation.
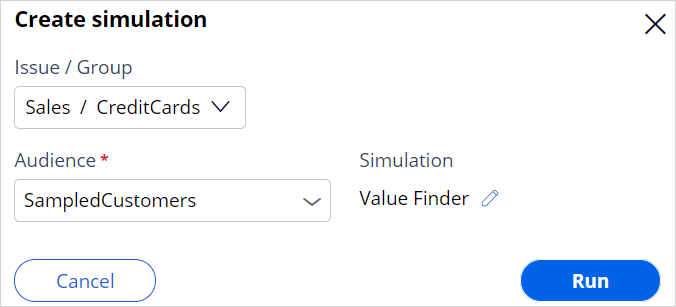
To create a Value Finder simulation run, select the issue and group in which you want to find opportunities. Then, select an audience on which to perform the simulation run. The audience is a list of potential target customers. You can modify the simulation name as required to identify the specific runs easily.
Once the simulation run is complete, the value finder indicates several opportunities.
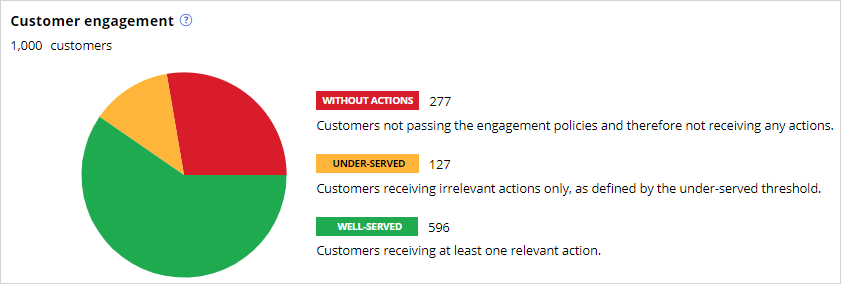
The pie chart displays the cumulative numbers of customers without actions, under-served customers, and well-served customers after arbitration. The pie chart shows the results after eligibility, applicability, suitability conditions, and arbitration are applied. The Without actions category indicates the number of customers who received no actions. The Under-served category indicates the number of customers who received low propensity actions. The Well-served category indicates the customers who received high propensity actions.
Value Finder identifies several opportunities to improve the Next-Best-Action Strategy.
Value Finder provides three different types of recommendations:
- Loosen a strictly defined engagement policy condition type: Eligibility, Suitability, and Applicability
- Shift to more empathetic arbitration settings
- Create more relevant actions or treatments
These results show how many customers the business loses after a particular Next-Best-Action stage.
In this case, the first opportunity shows the number of customers who are unable to receive actions due to suitability conditions. The second opportunity represents a group of customers that are underserved due to eligibility conditions. These customers receive less relevant actions with low propensity. The third opportunity shows the number of customers twho are unable to receive actions due to eligibility conditions.
Notice that 258 customers have no actions because the suitability condition may be too strict, 201 customers are underserved because they have no relevant actions or treatments, and 19 customers have no actions because the eligibility condition may be too strict.

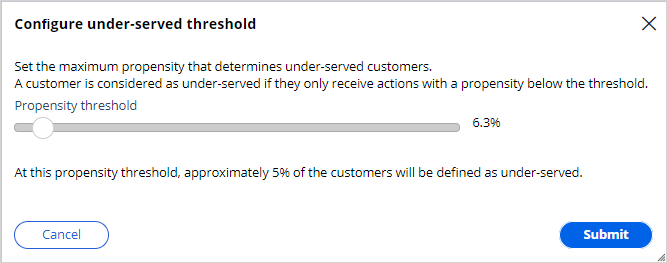
Value Finder identifies customers as underserved if the propensity of every action and treatment available to the customer is below the threshold propensity. To provide a convenient starting point, Value Finder chooses the initial propensity threshold value so that 1 out of 20 customers is defined as under-served. In this case, this results in an underserved threshold of 6.3%.
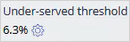
If the business wants to present offers with a higher propensity, this threshold value can be changed.
Details are provided for the Create more relevant actions and treatments recommendation to show how eligibility conditions contribute to the issue. Although Value Finder provides information for all engagement policy conditions, you must look at the Eligibility details to create more actions and treatments.
You can view Applicability and Suitability details for more insights.
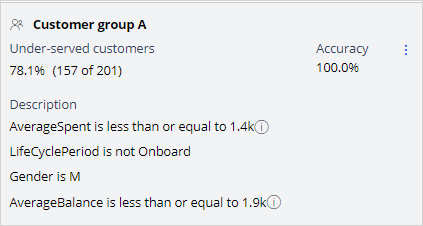
Value Finder supplies the following information about each group:
Under-served customers: The number of underserved customers in the group.
Description: Group characteristics such as Age or LifeCycle Period.
Accuracy: The number of under-served customers in the group divided by the total number of customers in the group. If the accuracy is 100%, this means that all customers in the group are underserved. If the accuracy is lower, for example, 94.1%, then 94.1% of the customers in the group are underserved. The remaining 5.9% have at least one action above the propensity threshold.
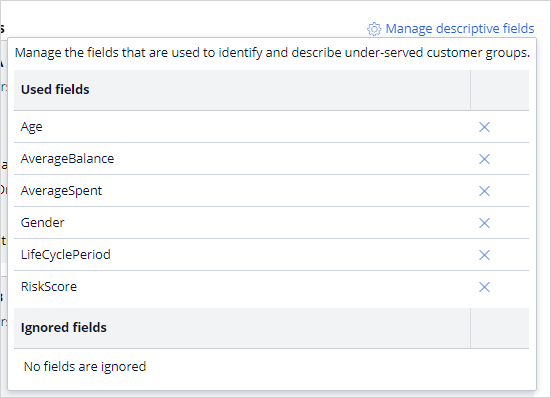
You can also manage the group by removing a field from the description. Typically, the system lists all potential fields available for the Next-Best-Action strategy. You can decide to remove a field from the list if it is not a required field. For example, if the business does not want to categorize customers based on age to avoid discrimination, they can remove the Age field from the list. If a field is removed, Value Finder then recalculates the values for Under-served customers and Accuracy.
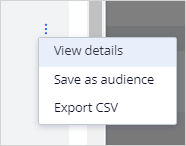
You can also save or export the customer groups that are identified as underserved as audiences.
You can then run distribution tests to get more insight into the current actions that these audiences receive. Use Value Finder recommendations and your distribution test results as feedback for business stakeholders. This information can inspire them to create new actions and treatments that are relevant to these customers.
In this specific scenario, 258 customers are presented with no actions due to the suitability condition. You can further analyze and view the suggested recommendation to provide more customers with actions. Use this information from Value Finder to run a funnel filtration on an audience simulation to detect which level the suitability condition is preventing customers from receiving an action. (whether it is the suitability condition at the group level or the action level). You can also look at the no actions due to the eligibility category to view the suggested recommendation.
This demo has concluded. What did it show you?
- How to configure and run a value finder simulation
- What the top opportunities identified by Value Finder are
- How to interpret the customer group in the under-served customer category
- How to interpret the without actions customer category
- How to interpret the under-served customer category
This Topic is available in the following Module:
If you are having problems with your training, please review the Pega Academy Support FAQs.
Want to help us improve this content?