Application data for Insights
As a Pega Business Architect (BA), you work with organizations to transform their business processes and educate them on the tools available for analyzing how that transformation impacts their operations. For example, a manager in the automotive claims department can create an Insight that details the average time it takes to resolve Cases with the redesigned workflow of Pega Platform™. Comparing this information to the average time for Case resolution before Pega helps the manager and the organization calculate the return on investment for the Pega application.
In this topic, you examine different processes for analyzing data using the Explore Data landing page and Insights. You also review the Business Intelligence Exchange (BIX) as a tool for extracting Pega data for a broader analysis by an organization.
The Explore Data landing page
With the Explore Data landing page, users can explore and analyze your application data quickly. Users can query data, and then sort, filter, and group the results based on the business requirements. For example, with the Explore Data landing page, you can access the list of Assignments that are routed to members of your team. You can then drill down and analyze the Assignment statuses to determine the remaining workload for the current release. You can save queries that you make on the Explore Data landing page as Insights.
Explore Data uses a View-based landing page and is the preferred data exploration tool for applications that use the Constellation design system.
Insights
Insights are Rules that Pega Platform uses to transform data queries into tables or visualizations that users can share. Teams can use Insights to retrieve specific data and present the data as a list or an interactive chart. For example, in an insurance application, users can visualize data for claims that are pending approval, and then analyze the type of claim and the amount submitted by users.
The Explore Data landing page displays a list of previously-created Insights; you can view or edit an Insight or create a new Insight.
In the following image, click the + icons to learn more about the actions that can be performed on the Explore Data landing page:
Working with Insights
On the Explore Data landing page, application users can easily create both table and chart-based Insights. By using drag-and-drop functionality, users can easily add or remove fields from Columns (Tables) or Measures and Dimensions (Charts) to provide robust data analysis.
In addition to creating new Insights, users can also select a previously-created Insight to view or modify.
In the following image, click the + icons to learn more about the actions that you can perform on an Insight:
Simple value charts
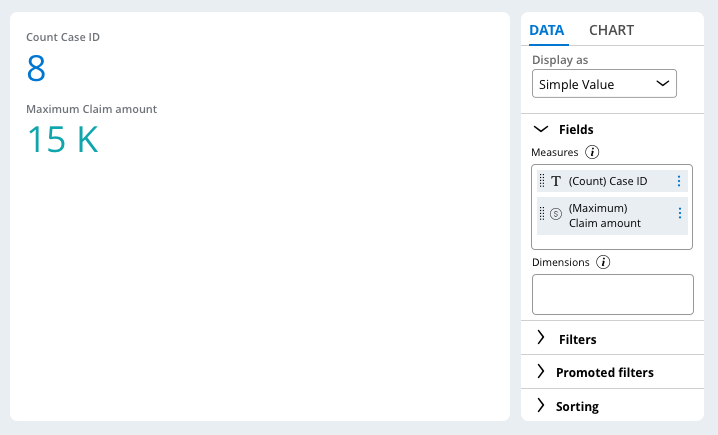
A simple value chart is a high-level summary of data. To configure a simple value chart, in the Fields section, select fields in the Measures area only. The Display as list then updates to include the Simple Value option.
The following figure displays a simple value chart with the count of Case IDs and the maximum claim amount:
For a simple value chart, the layout of values is customizable. In the Layout list, choose from the following options:
- Highlight to display the values of all data series.
- Highlight + summary to display the value of one data series only and include other data below that series.
- Custom highlight + summary to create a custom layout.
The following figure displays the Chart tab for a simple value chart:
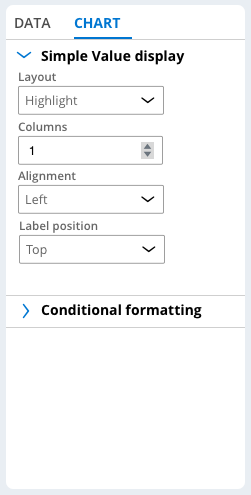
Depending on the selected layout, you can customize specific arrangement settings. It is also possible to add conditional formatting for a simple value chart.
Note: For more information about Insights, see Visualizing data with Insights.
Extracting data using BIX
Organizations are not limited to using Pega data with the Explore Data landing page and Insights. Organizations can create a broad view of their business by integrating Pega Platform data with data from other systems of record using BIX. BIX extracts transactional data from the Pega database into formats suitable for exporting to a reporting data warehouse, operational data store (ODS), or other downstream process.
BIX provides the extract functions of an extract, transform, and load (ETL) utility. BIX is a batch-processing tool that extracts data from one class at a time. You can use it to do a full extract or an incremental extract based on when a target property changes.
Note: For more information about using BIX to extract data from an application, see Data extraction.
Insights vs BIX
As a Pega BA, you are likely to help design the infrastructure to support the analytical and reporting needs of the client organization. One of the key questions you are likely to face is when to use Insights for data analysis and when to use BIX.
In general, if analysis depends on operational reporting on real-time information in Pega, use Insights because the data arrives in real time and is available in the same environment. If there is a need to combine Pega data with data from other systems of record in the analysis, or when the organization wants to investigate or mine large historical Data Sets for information, then extracting the data from Pega with BIX and importing it to an external database for further analysis might be the appropriate solution.
Check your knowledge with the following interaction:
This Topic is available in the following Module:
If you are having problems with your training, please review the Pega Academy Support FAQs.
Want to help us improve this content?