Distribution tests
What is a distribution test simulation?
A distribution test simulation enables you to unit test a decision strategy. You can execute a simulation on an input audience, output the results to a database table and view the results using out-of-the-box simulation reports.
You can use these reports to inspect the number of actions offered in general, the number of actions across various channels, the average propensity of the actions, the ranks at which each action is offered, and so on. This is particularly useful when creating or changing an action and understanding the possible implications of that change.
Let’s look at the Action distribution and Action priority reports as examples of the available reports.
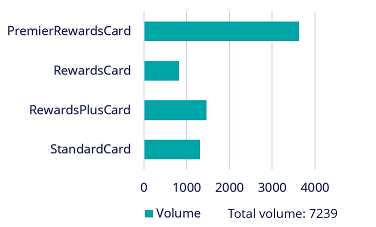
Action distribution shows the volume per action. That is, how many times each action was output by the decision strategy. In the report you can also see the total volume of actions.
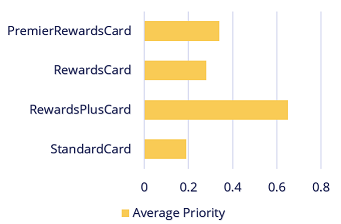
The Action priority report shows the average priority of each action. Here you can see that the RewardsPlus card offer has the highest average priority, meaning the expectation is that this will be the best performing action. If an action has a low average priority, the chance of this action being offered may also be lower.
This Topic is available in the following Modules:
If you are having problems with your training, please review the Pega Academy Support FAQs.
Want to help us improve this content?