
Error investigation with the Tracer
Investigate application errors with the Tracer tool
You use the Tracer tool to investigate an issue, by configuring the Tracer to monitor application execution. As your application executes, Pega logs all the processing events that result from application execution. You view the events logged by the Tracer to analyze processing errors and identify their cause.
Tracer displays each event on a separate row. The records display according to the following color code.
- Gray – Activity processing
- Orange – Events from flow, decision, or declarative rules
- Light blue – PegaRULES database and cache operations
For more information on the records the Tracer displays, see the Help topic Tracer results window.
You can access the Tracer from the Runtime toolbar in App Studio and from the Developer toolbar in Dev Studio.
The Tracer logs all the actions and events that occur in a requestor session in Dev Studio. Each event is logged in order of occurrence and is identified by thread, event type, and status.
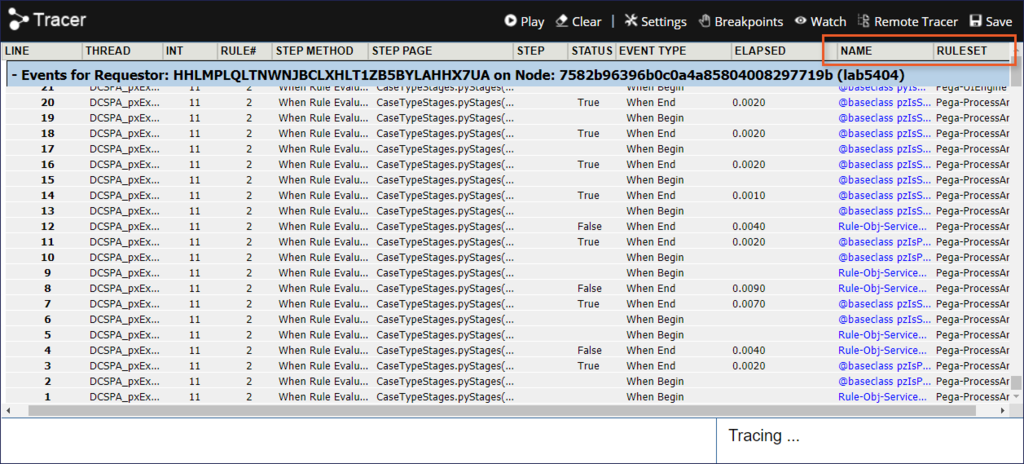
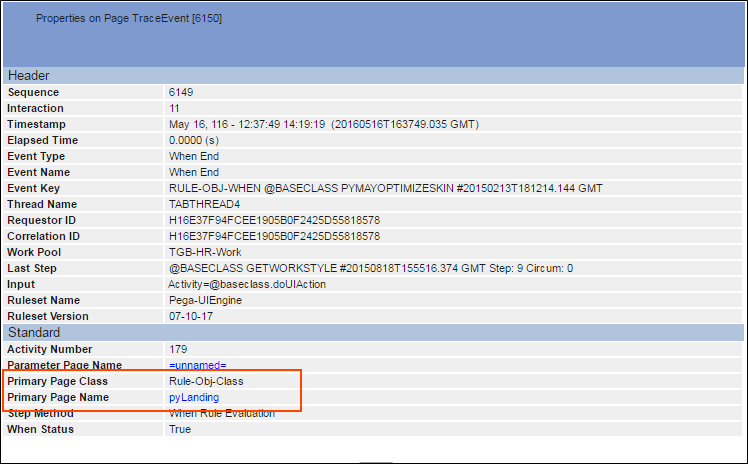
The Name and Ruleset columns identify the rule name and the related ruleset for each line item. Selecting a line item from the Name column opens the rule to review the rule for possible issues. Selecting a row in the Tracer tool allows you to view details about the event. The details are displayed in a new window. From this window, you can view the contents in memory at the time the event occurred. When you finish reviewing the event properties, close the window to return to the Tracer tool.
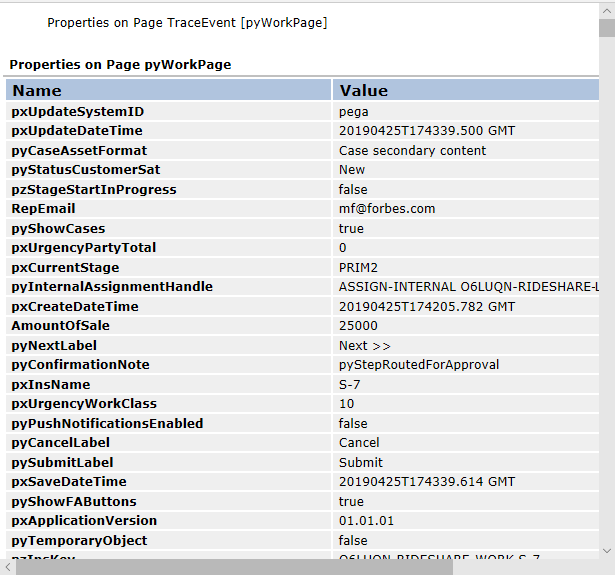
Selecting a line item in the Step Page column displays a list of page properties and their values at the time an event executes. You can use this information to determine if the values are different than expected.
For example, the following image shows sample Tracer results. The user clicks the Step Page column for event 11391 to display the properties on the pyWorkPage.

If you are having problems with your training, please review the Pega Academy Support FAQs.
Want to help us improve this content?