Error investigation with the Tracer
The Tracer tool allows you to trace events that experience errors during application runtime.
Access the Tracer
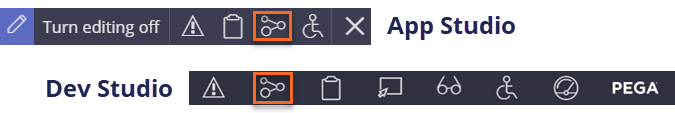
You access the Tracer by toggling the Runtime toolbar in App Studio. Hover your pointer over the lower-right corner of the screen to see the Toggle runtime toolbar option. Or, you can access the Tracer tool from the Developer toolbar in Dev Studio.
The following image shows the Tracer icon in App Studio and Dev Studio:
Tracer events
By configuring the Tracer to monitor application execution, you can investigate issues and events logged by the Tracer to identify their cause.
Tracer displays each event on a separate row. The records are displayed according to the following color code:
- Gray – Activity processing
- Orange – Events from flow, Decision, or declarative Rules
- Light blue – PegaRULES database and cache operations
Note: For more information on the records the Tracer displays, see Tracer results window.
Tracer tool captures the different events that occurs during Case processing. Each event is logged in order of occurrence and is identified by a thread, event type, and status.
In the following image, click the + icons to view details about some of the columns in the Tracer window:
Event details
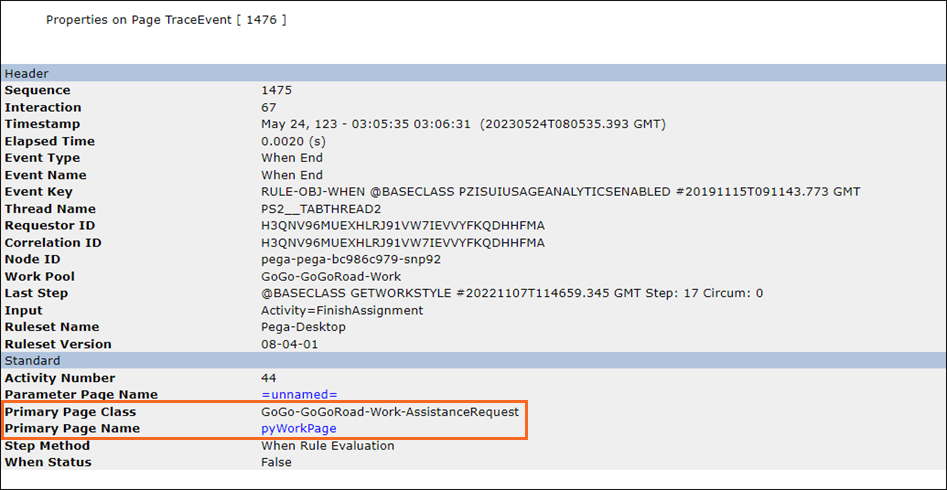
Click on a row within the Tracer tool to view details about the event in a new window. From this window, you can see the contents in memory at the time the event occurred, when you finish reviewing the event properties, close the window to return to the Tracer tool.
The following image shows the details on Properties on Page TraceEvent window such as the page class and page name:
Page properties and values
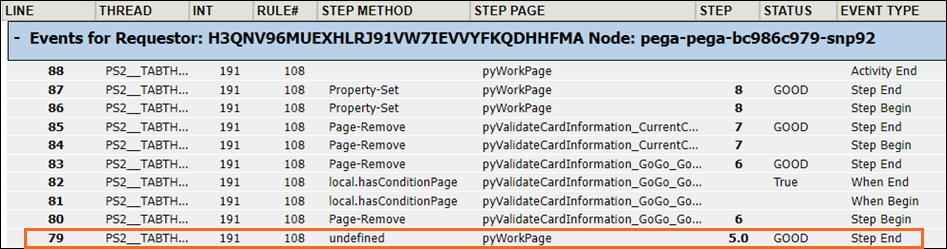
Selecting a line item in the Step Page column displays a list of page properties and their values at the time an event executes. You can use this information to determine whether the values are different than expected.
For example, in the following image the line item for event 79 shows an undefined Step method in the Step Method column:
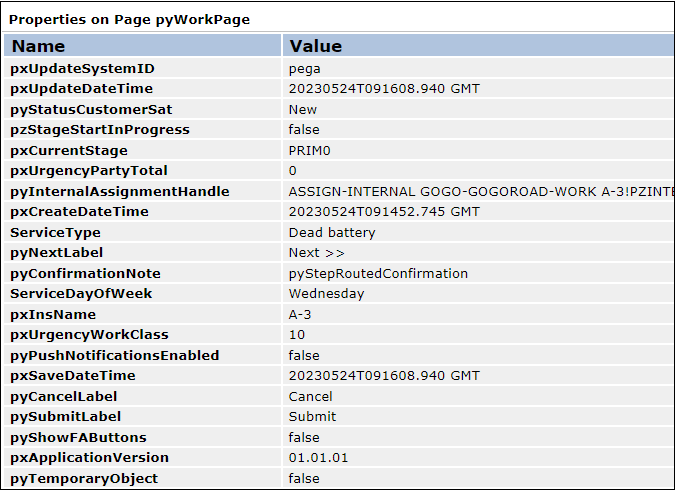
The following image shows the properties that are stored on the pyWorkPage at the time the event 79 is executed:
Check your knowledge with the following interaction:
This Topic is available in the following Module:
If you are having problems with your training, please review the Pega Academy Support FAQs.
Want to help us improve this content?