Monitor application quality
Showing and measuring the quality of an application on a regular basis is essential to building robust applications. Quality metrics consists of two types of metrics:
- Functional (Logic/Design related)
- Non-functional (System/Infrastructure) metrics.
No list of defined metrics exists. Every product and company can develop its own metrics to measure quality.
Application Quality dashboard
Pega provides an Application Quality dashboard, which displays metrics that show the health of the application.
The following metrics are defaults on the dashboard:
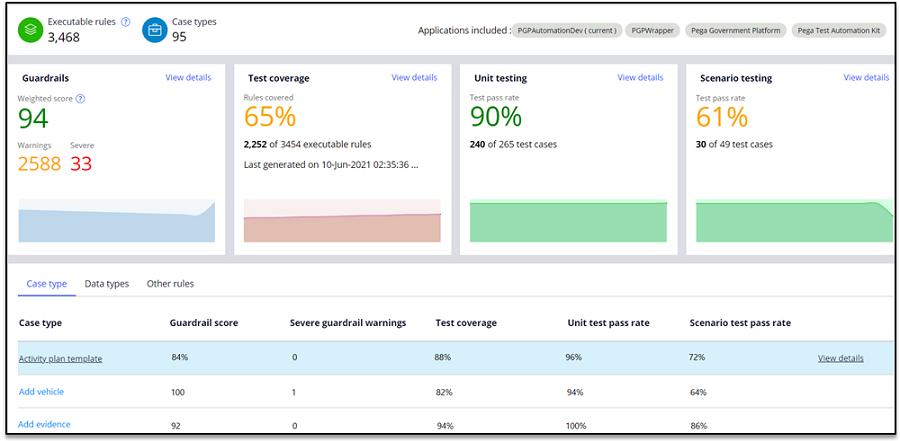
- Guardrails: Shows the guardrail score for the application and the number of warnings and severe warnings.
- Test coverage: Shows the percentage of rules covered from the executable rules in the latest application-level test report generated by this application.
- Unit testing: Shows the unit test pass percentage, considering the latest test results of unit test cases in the application.
- Scenario testing: Shows the scenario test pass percentage, considering the latest test results of scenario test cases present in the application.
This dashboard also shows the trend of the metrics over a set period.
The following image of the Application Quality dashboard shows four default metrics and their trends over a period of time. This dashboard also contains detailed metrics about case types and data types:
The Application Quality dashboard shows the quality metrics on two levels:
- Application level: This level shows metrics for the entire application or the application stack.
- Case type or Data type level: This level shows metrics for each case type and data type in detail.
The Application Quality dashboard includes a link to the Quality settings page, on which you configure quality settings that customize how users view the metrics on the dashboard.
Check your knowledge with the following interactions:
Test coverage
Test coverage is a metric that provides details about the code that is covered when testing is performed. User can use this feature to understand if there are enough tests to ensure that the entire application code is executed with the testing.
Note: 100% test coverage does not mean 100% tested.
In Pega Platform™, this feature gives information about the rules that are covered (Hit) and not covered (Not hit) with the testing performed in a testing session. The testing activity can be a combination of running automated tests (Pega Unit tests, Pega Scenario tests, Selenium tests and so on) and manual tests.
Check your knowledge with the following interaction:
A rule is considered covered if it is invoked at least once during the testing session. The following image depicts the 26 rule types that the feature supports:
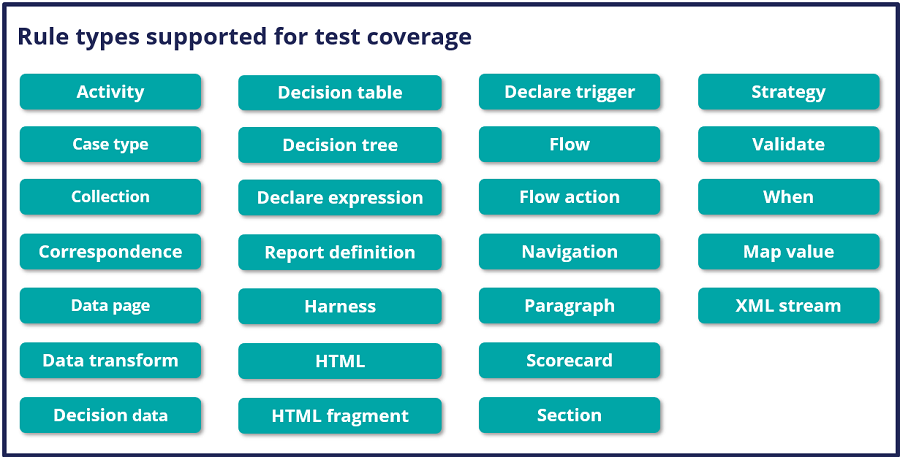
The Test coverage report includes coverage information about only the supported rule types (listed above).
Check your knowledge with the following interaction:
The following image shows how test coverage projects the metrics for an application that has 1,000 rules, from which 600 rules belong to supported rule types:
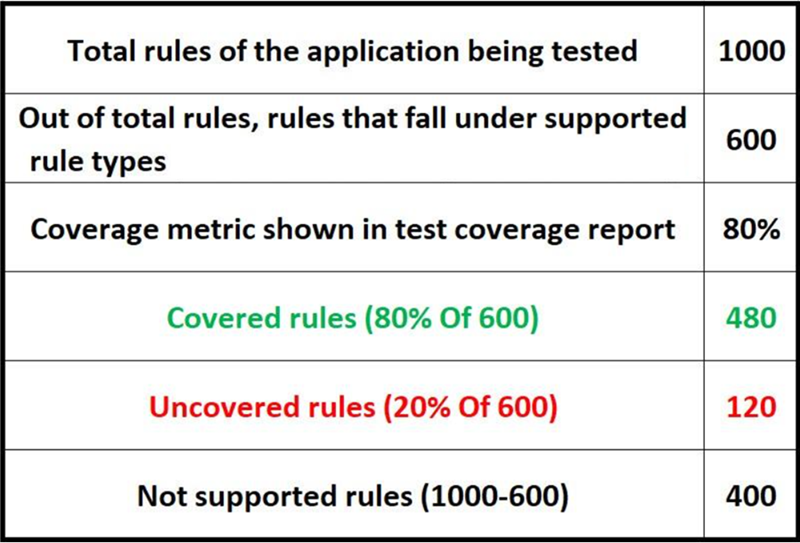
When a test coverage report is generated in Developer Studio, it looks like the image shown below. Rules that belong to the supported rule types are shown as "Executable rules". Counts of "Covered rules" and "Uncovered rules" along with the complete list of rules belonging to each type are also shown.

Test coverage is generated at the following two levels:
- User level: A user-level coverage report can be used to generate a local test coverage report by a single user in a single session. If the user wants to generate a test report against a set of test cases in the application, and does not want the report to be considered for the purpose of quality metrics, the User level option can be used. This is entirely a user-specific report.
- Application level: An application-level coverage report can be used to generate a test coverage report for the entire application, with the testing performed by multiple people across multiple sessions. This is useful when regression testing an entire application. This metric can be found in the application quality metrics dashboard for the application.
Check your knowledge with the following interaction:
The Test coverage feature also offers the following capabilities:
- Merge test coverage reports: It is possible to merge most recent test reports of different applications or test reports of multiple built-on applications into a single test report to obtain a consolidated overview of the test coverage of the entire application stack. This is especially helpful when multiple development teams are working on a single base application by building multiple built-on development applications on top of it.
- Test coverage of recently updated rules: If a team is developing new rules for an existing application from last two sprints and has authored test cases for these new rules, they can use this feature to find the coverage of all the new rules against a specific test session. To perform this, the team must supply a Date filter to consider only those rules which have been created or updated after a certain date.
- Test coverage history: History of both the User-level and Application-level test coverage reports can be accessed to understand the progress over a period of time.
This Topic is available in the following Module:
If you are having problems with your training, please review the Pega Academy Support FAQs.
Want to help us improve this content?