Pega application monitoring
Pega application monitoring
Many organizations have application performance monitoring (APM) tools in place to track and report on application performance and responsiveness. While these tools can report on data such as memory and CPU usage on your database and application servers, they do not provide detailed information about the health of the Pega application itself.
Pega provides two tools designed to monitor as well as provide recommendations on how to address alerts generated by the Pega application. These tools compliment any APM tools you might be using to give you a complete picture of the health of your Pega application.
- Autonomic Event Services (AES) – AES monitors on-premise applications. AES is installed and managed on-site.
- Predictive Diagnostic Cloud (PDC) – Pega PDC is a Pega-hosted Software as a Service (SaaS) application that monitors Pega Cloud applications. PDC can also be configured to monitor on-premise applications.
Admin Studio - Pega Admin Studio is a role-based authoring and management environment focused on system operations such as agents, queues, and APIs. Admin Studio is targeted for experienced system administrators.
The tool you use depends on your monitoring requirements and if you want to customize the monitoring application.
The following table compares differences between AES and PDC.
| PDC | AES | |
| Hardware provisioning | Pega | Customer |
| Installation and upgrades | Pega | Customer |
| Ability to customize | Upon request | Fully customizable |
| Release schedule | Quarterly | Yearly |
| Communication with monitored nodes | One-way | Two-way |
| Active system management (restart agents, listeners, quiesce node) | Not available | Available |
Both AES and PDC monitor the alerts and health activity for multiple nodes in a cluster. Both send you a scorecard that summarizes application health across nodes. The most notable difference, from an architecture standpoint, is that AES interacts with the monitor node to allow you to manage processes on the monitored nodes, such as restarting agents and quiescing application nodes.
You can use AES or PDC to monitor development, test, or production environments. For example, you can set up AES to monitor a development environment to identify any troublesome application area before promoting to higher environments.
For more information on AES and PDC see the following resources:
Monitoring health of the system
Monitoring the health of the system is as important as the performance of an application. Pega platform provides many options to assess the system health on different parameters. LSA should be aware of the Pega tools to monitor the system's health, A few of the tools provided by Pega are discussed below:
Performance data
Pega platform continuously generates data about the performance without impacting system performance. Performance data can be obtained using PAL. PAL provides information such as rule/server / RDB elapsed time, CPU statistics, and other I/O operations. Analysis of the data helps to understand the cause of delay in navigation from one view to another. Performance information about the execution of activities, when rules and data transforms can be obtained by Performance Profiler.
Pega Platform continually generates performance data (PAL) and issues alerts if the application exceeds thresholds that you have defined.
Lightweight lists data
Lightweight lists require less CPU memory and less processing than standard page lists. Lightweight lists are recommended wherever possible. The ‘rules not using lightweight lists report will help to identify rules the lightweight list can be used. It can be also controlled using the DSS setting(for example clipboard/lightWeightList/enableForCorePRPCRules and clipboard/lightWeightList/enableForCustomerRules). An LSA should be aware of the limitations and usage of Lightweight lists to improve the performance of the application.
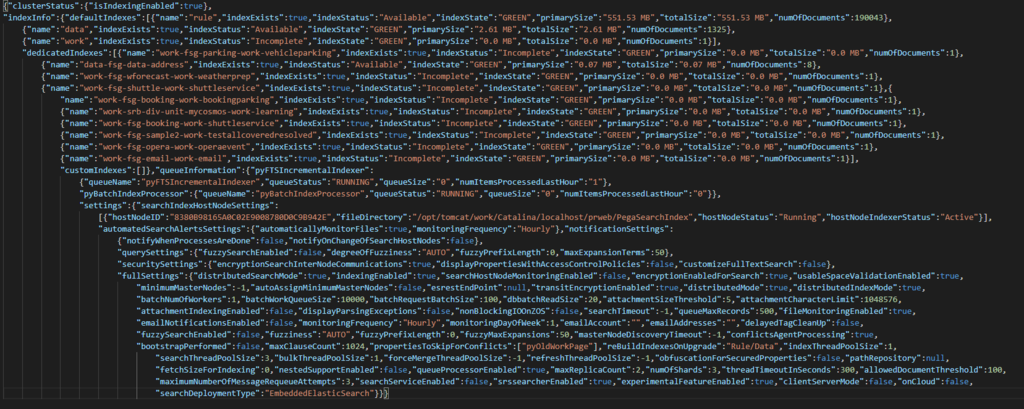
System state data
System state data that contains information like data and work index status, the queues, and their status, etc., is presented in JSON format. System state data can be downloaded from Admin Studio or it can be accessed using the REST API. Comparing the state of the system over time will help to determine what might have changed on the system that caused the problem.
JVM data
The version of JDK and configuration of Heap Memory, its increment will have an impact on the memory performance and overall system throughput. Virtual memory allocation is an important system design consideration. JVM vendor recommendations should be followed and the required memory should be allocated to avoid some of the common problems like the out-of-memory exception.
Services data
Pega application services can be tracked separately to know the impact those services have on Pega application performance. The PEGA0011 alert and the Service-PAL log file will help to identify issues related to services. Changing the parameters of lengthy services or parsing rules can be considered to improve the performance after analyzing the alert and service-PAL log files.
A detailed discussion of the health monitoring Pega tools is available here .
A sample JSON of the system state for the FSG application
If you are having problems with your training, please review the Pega Academy Support FAQs.
Want to help us improve this content?