Pega Customer Service reports
Monitoring the contact center
Managers observe a Pega Customer Service™ application through:
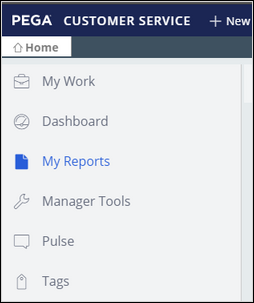
- My Reports
- Dashboard
Reports
Pega Customer Service comes with many reports that are out of the box. Pega Customer Service includes a variety of standard reports, graphs, and reporting tools. These provide real-time information and analysis of processes, work, assignments, and historical data of customer satisfaction and contact center performance over time.
Reports are accessed from the My Reports tab in the Interaction portal.
More than 100 different reports are used to monitor your application. These reports are placed into different categories to make them easier to find. For example, in the Interaction reports category there are reports that show key metrics like average handle time, the interaction reason of the customer, and the different channels interactions are taking place in.
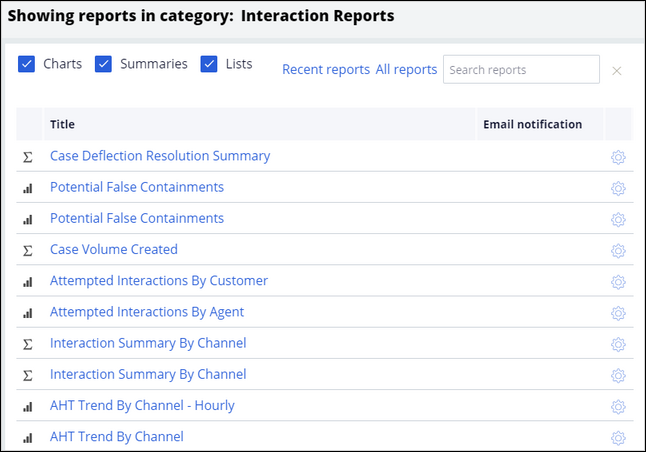
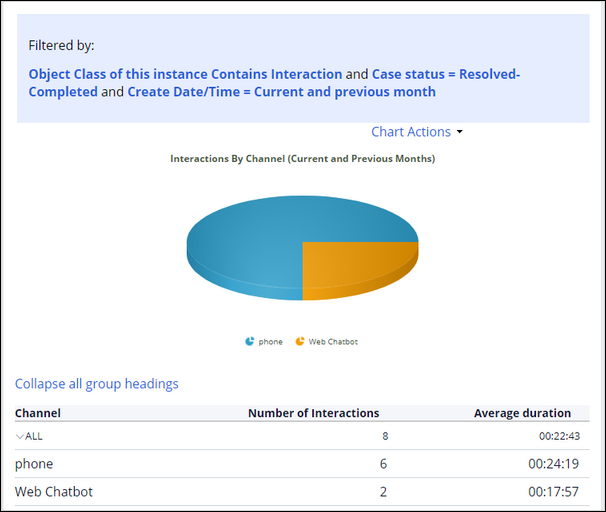
Select the report you want to view--for example, Interaction summary by channel--and the report is displayed.
A report is used when you want to:
- Drill down into details of a report
- Examine multiple attributes impacting a key performance indicator (KPI)
- Export reports for offline triangulation or interrogation often by non-Pega users
Note: To see a description of all available reports, refer to Pega Customer Service Reports in the Pega documentation.
Dashboard
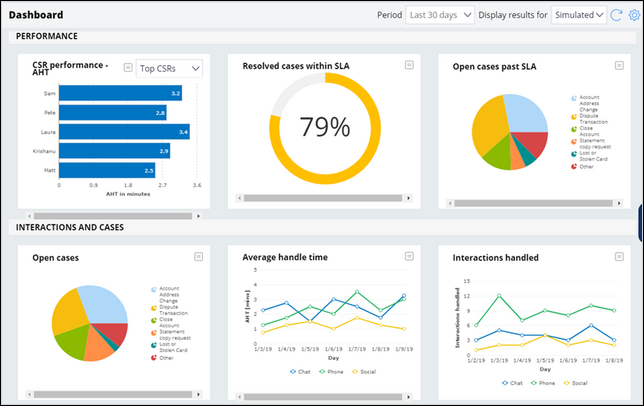
A dashboard is a centralized workspace that displays operational information about your application and key performance indicators, such as the number of assigned items or the average time to resolve a case. It can include charts, reports, worklists, and other widgets.
Pega Customer Service leverages dashboard widgets that are out of the box. A dashboard is a part of the user interface that contains one or more widgets grouped into slots. Click the gear icon to customize the dashboard and add or remove widgets for the information you want displayed.
A dashboard widget is used when you want to:
- Get a snapshot within the product on one or two data points that inform contact center performance--the summarized data can be noted in a single glance
- Give individual users an update on their own performance or team performance
Reports shown on the Dashboard are based on the role of the user who is logged into the Interaction Portal.
This Topic is available in the following Module:
If you are having problems with your training, please review the Pega Academy Support FAQs.
Want to help us improve this content?