
Prediction Studio
Introduction
Prediction Studio is the dedicated workspace for data scientists to control the life cycles of predictions created in Pega Customer Decision Hub™ to optimize 1:1 customer interactions. From Prediction Studio, you can also manage additional resources, such as data sets, summaries and predictive models.
Video
Transcript
This video shows how you can use Prediction Studio to control the life cycles of predictions and the predictive models that drive them.
Predictions combine predictive analytics and best practices in data science.
In Pega Customer Decision Hub™, many predictions are available out-of-the-box. They are listed on the Predictions landing page in Prediction Studio.
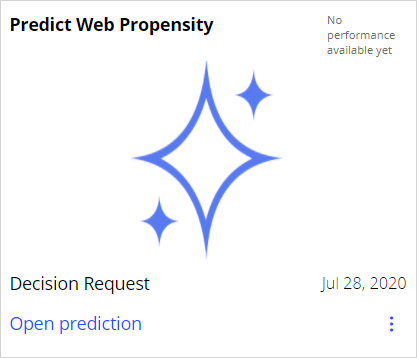
For example, Predict web propensity aims at predicting the likelihood that a customer clicks a web banner.
Consider as an example the cross-sell on the web scenario of U+ Bank. The bank shows a personalized credit card offer to eligible customers when they log in to the banks’ website.

When a customer is eligible for multiple credit cards, the prediction calculates the propensity to receive a positive response from the customer for each card.
Customer Decision Hub decides which credit card to offer based on business rules, interaction context, and predictions.
A predictive model drives every prediction. The predictive model that is active in the Predict Web Propensity prediction is the Web_Click_Through_Rate model.
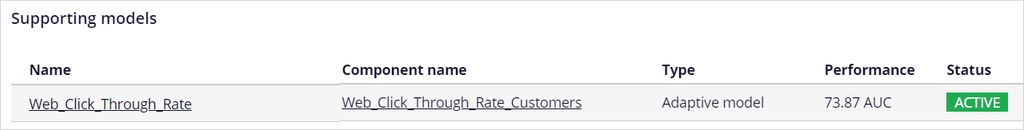
This is an adaptive model that continuously learns from customer interactions. It adapts to changes in customer behavior over time.
You can configure several aspects of a prediction.
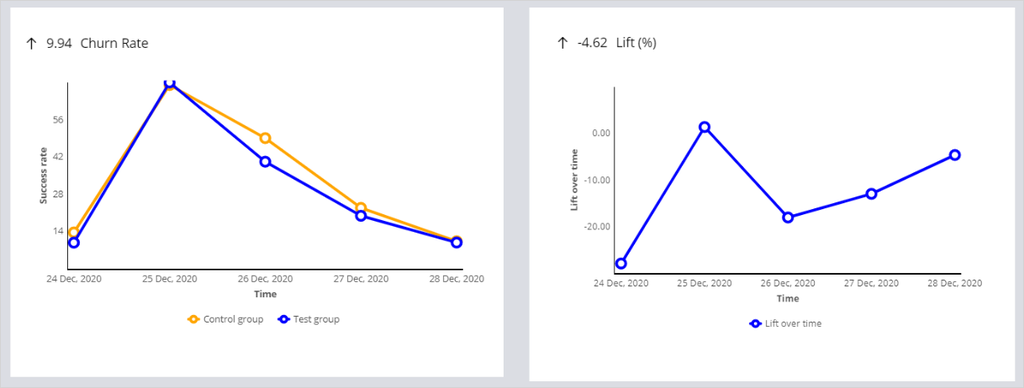
A control group is a small group of customers who receive random offers, as opposed to the test group.
Customers in the test group receive the offers that they are most likely to accept, based on the propensity that the prediction calculates for each customer.
The purpose of the control group is to calculate lift by comparing the success rate in the control group with the success rate in the test group.
The random offers also allow for continuous exploration of the predictive models.
Based on the lift, you can determine the effectiveness of your prediction, for example, in increasing conversion rates.
The control group is typically defined as 2% of all customers, but this can be changed.
The response labels represent the possible outcomes of a prediction.
The propensity is computed based on the number of outcomes registered under the target label versus the alternative label.
For example, in Predict Web Propensity, as you want to predict the likelihood of a customer clicking a banner, the Target label (which in this case represents the positive outcome) is Clicked.
The alternative label that represents a negative outcome in this case, is NoResponse.
The NoResponse response can be captured on request or automatically depending on the response time-out setting.
The response time-out defines how long to wait for the customer to respond to your offer.
After the specified amount of time elapses, the system automatically records the alternative outcome for the interaction.
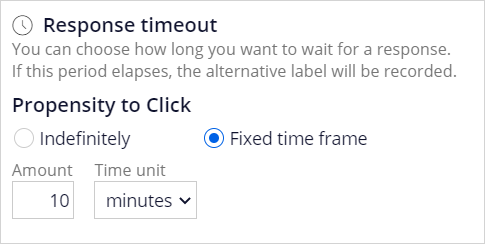
This setting depends on the use case.
When predicting a click on a web banner, you typically set it at 30 minutes or less, but in an outbound email offer, a waiting time of several days is more appropriate.
The Web_Click_Through_Rate model that drives the prediction is the template for a model for each of the credit card offers.
You can monitor the performance of the models in a diagram that shows the success rate versus model performance.
Colored circles represent the models. The size of the circles indicates the number of responses captured by the model.
Suppose that U+ Bank wants to introduce proactive retention by showing a retention offer instead of a credit card offer to customers that are about to leave the bank.
That configuration requires a prediction that aims to calculate the churn risk for each customer, ideally based on the banks’ historical data.
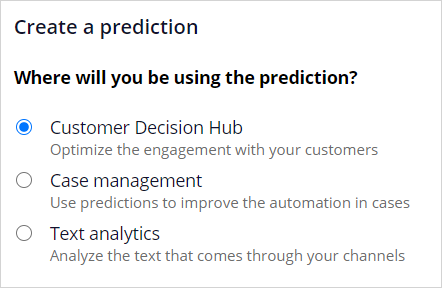
Pega supports creating three types of predictions: predictions that optimize the engagement with customers, predictions that improve business processes …
… and predictions that analyze the text of incoming messages.
To analyze how successful the prediction is, monitor it over time.
Available metrics are the success rate, the lift calculated using the control group, the prediction performance, and the total number of cases.
Prediction Studio generates actionable insights and notifies the user when predictions and predictive models show unexpected behavior (for example, a significant drop in success rate).
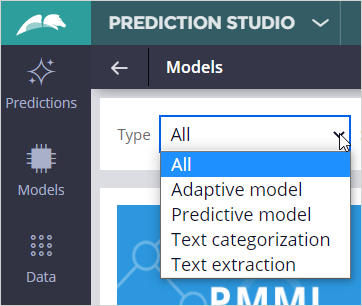
On the Models landing page, all available models are listed. These are adaptive models, predictive models, and text categorization and extraction models.
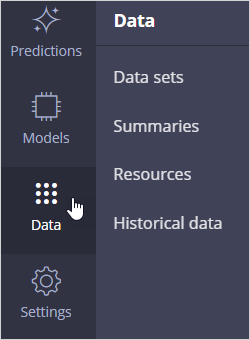
Resources such as data sets and summaries are available from the Data tab.
When enabled, historical data that is used for the training of adaptive models and monitoring of predictive models is recorded for offline analysis.
Under Settings, you can review the company policies regarding model transparency.
Model transparency is becoming an important requirement for many businesses.
In risk management, decisions must be explainable. In marketing, more accurate models may be allowed at the expense of transparency.
The lead data scientist sets the transparency thresholds for different business issues.
Each model type is assigned a transparency score ranging from 1 to 5, where 1 means that the model is opaque, and 5 means that the model is transparent.
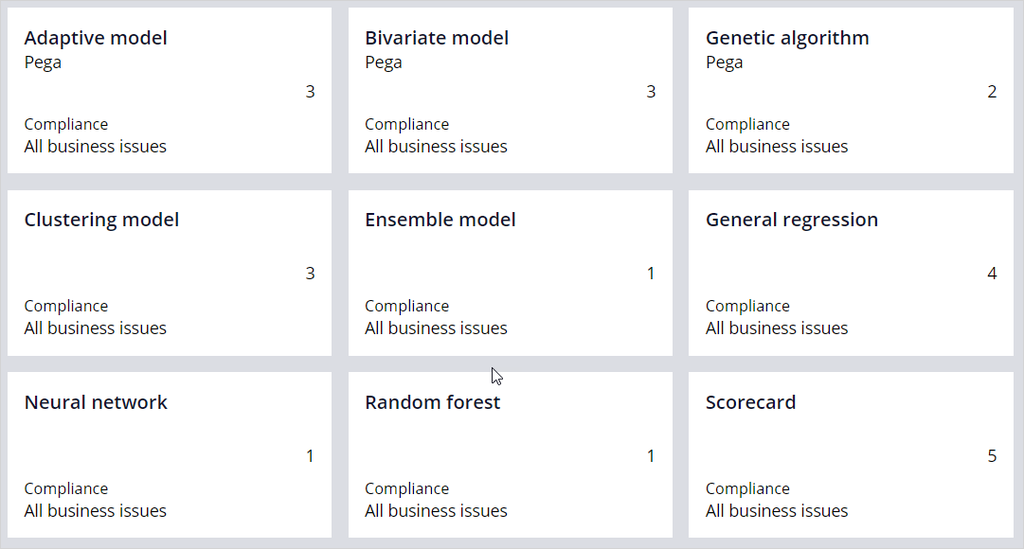
Depending on these settings, some types of models can be non-compliant for a specific business issue.
You have reached the end of this video. What did it show you?
- How you can manage the lifecycles of predictions and the predictive models that drive them in Prediction Studio
- How to examine the model transparency setting of the business
If you are having problems with your training, please review the Pega Academy Support FAQs.
Want to help us improve this content?