
Prediction Studio
Introduction
Predictions and the predictive models that drive them are created, monitored and updated in Prediction Studio, the dedicated workspace of data scientists.
Video
Transcript
This video gives you an overview of the features of Prediction Studio. The workspace provides data scientists with everything they need to author, deploy, govern, monitor, and change predictions. Prediction Studio has four work areas: Predictions, Models, Data, and Settings.
The Predictions landing page is used to create and manage predictions. Predictions can be one of three types.

Customer Decision Hub predictions are used in the Pega Customer Decision Hub™ application to optimize 1:1 customer engagement. Case management predictions are used in case types to support decisions in business processes and Text analytics predictions are used in the Pega Customer Service™ application to predict the topic of incoming messages. The three types of predictions differ to suit the domain they are used in, but one or more predictive models drive them all.
The Model landing page is used to create and manage the predictive models. There are four types of predictive models.
Static predictive models are built on historical data. A data scientist can create a predictive model in an external tool and import the model file. Another option is to connect to a machine learning service, such as Google ML or Amazon SageMaker.
Adaptive models continuously learn from responses and adapt to changes over time. You can configure an adaptive model rule that typically represents many adaptive model instances, because each unique combination of the model context will generate a model.
Text categorization models can detect the topic of a message and the sentiment of the author. Text extraction models identify entities such as an email address, an account number, or a city.

Many widely used Customer Decision Hub predictions ship with the product.

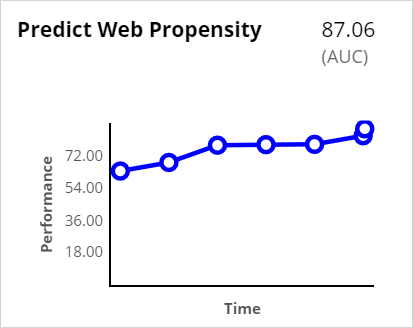
One of these is the Predict web propensity prediction, which predicts the likelihood that a customer clicks a web banner.
Consider, for example, the cross-sell in a web scenario for U+ Bank. The bank shows a personalized credit card offer to eligible customers when they log in to the bank's website.

When a customer is eligible for multiple credit cards, the prediction calculates the propensity of receiving a positive response from the customer for each card. Customer Decision Hub decides which credit card to offer based on business rules, interaction context, and predictions.
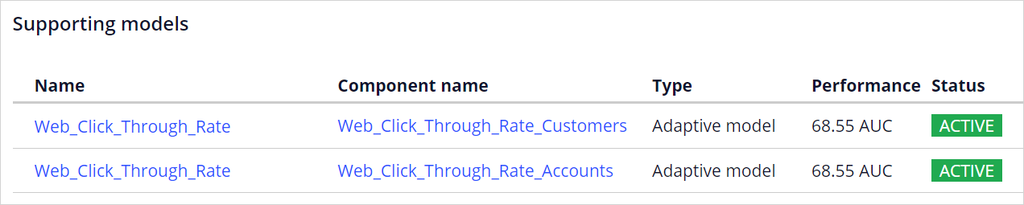
The adaptive model that drives the Predict Web Propensity prediction is the Web Click Through Rate model.
You can configure several aspects of a Customer Decision Hub prediction. A control group is a small group of customers who receive random offers, as opposed to the target group.
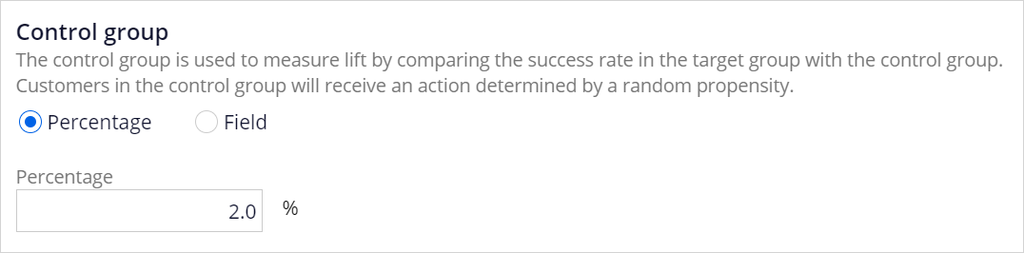
Customers in the target group receive the offers that they are most likely to accept, based on the propensity that the prediction calculates for each customer.
The purpose of the control group is to calculate lift by comparing the success rate in the control group with the success rate in the target group.
The random offers also allow predictive models to continuously explore all actions.
Based on the lift, you can determine the effectiveness of your prediction, for example, in increasing conversion rates. The control group is typically defined as 2% of all customers, but this can be changed.
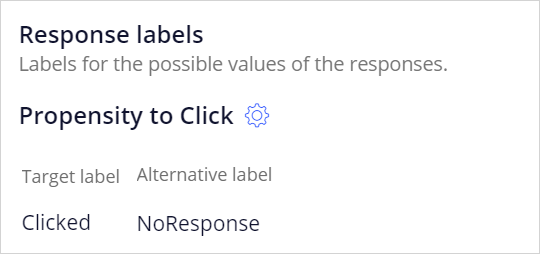
The response labels represent the possible outcomes of a prediction. The propensity is computed based on the number of outcomes registered under the target label versus the alternative label.
For example, in Predict Web Propensity, because you want to predict the likelihood of a customer clicking a banner, the Target label (which in this case represents the positive outcome) is Clicked. The alternative label that represents a negative outcome in this case, is NoResponse.
The NoResponse response can be captured on request or automatically depending on the response time-out setting. The response time-out defines how long to wait for the customer to respond to your offer. After the specified amount of time elapses, the system automatically records the alternative outcome for the interaction.
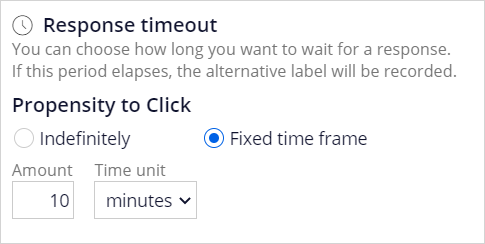
This setting depends on the use case. When predicting a click on a web banner, you typically set it to 30 minutes or less, but in an outbound email offer, a waiting time of several days is more appropriate.
The Web Click Through Rate model rule is the model template for each of the credit card offers. You can monitor the performance of the models in a diagram that shows the success rate versus model performance.
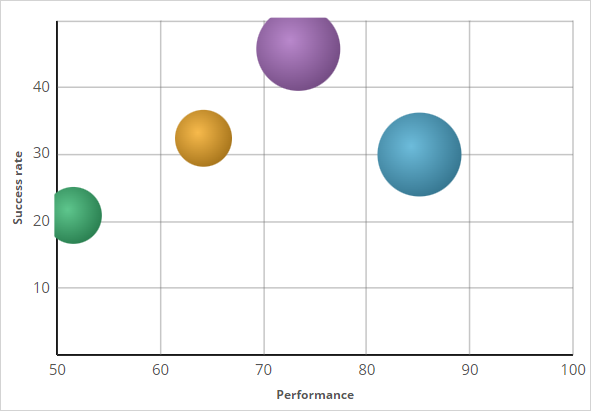
The models are represented by colored circles. The size of the circles indicates the number of responses captured by the model.
Monitor the prediction over time to analyze how successful it is. The available metrics are the success rate, the lift calculated using the control group, the prediction performance, and the total number of cases.

Prediction Studio generates actionable insights and notifies the user when predictions and predictive models show unexpected behavior (for example, a significant drop in success rate).

Case management predictions support decisions in a case type.

Consider this case type, which handles incoming car insurance claims.
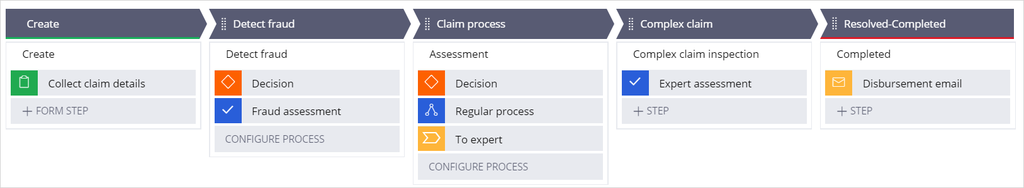
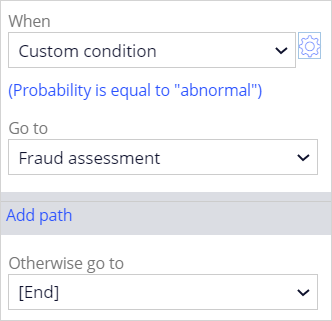
An application developer can use the outcome of the prediction in the condition of a decision step, instead of a business rule. Based on the condition, a case is routed to a fraud expert when the prediction flags the claim as abnormal.
The Pega Customer Service application can use text predictions to analyze messages that come in through various channels, such as email and chat channels.

A text prediction is automatically generated for each new channel.
A text prediction detects topics, entities, and sentiment, to improve the routing of messages to the appropriate department.
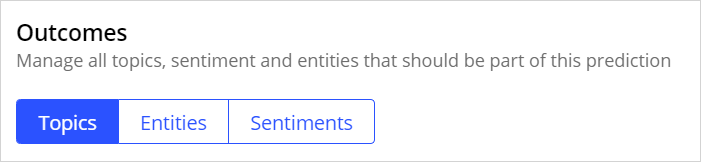
Topics can be detected based on keywords or machine learning. In this example, topic detection is keyword based. It is highly recommended to include machine learning in topic detection.
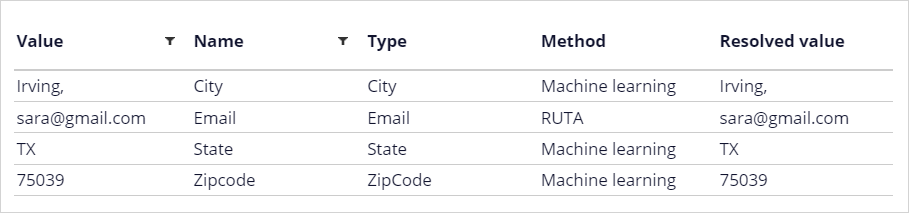
Consider the following message, about an address change:
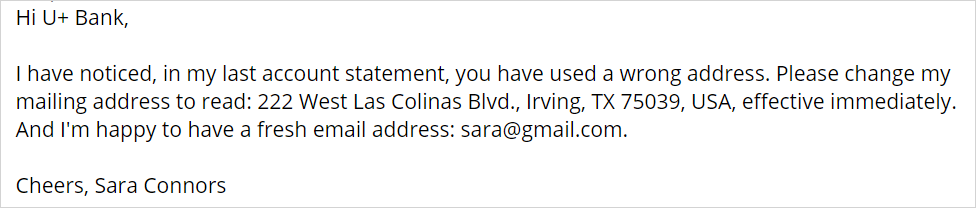
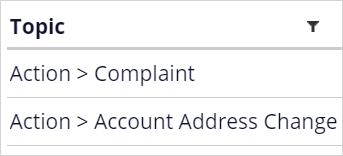
Based on keywords, two topics are detected. Both topics have a confidence score of 1, so it is not possible to determine the correct topic.
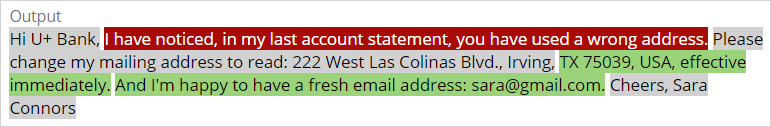
To train the topic model, use a data set with records that contain a message and the associated topic. When the trained model is tested with the same message, the model correctly generates the highest confidence score for the address change topic.
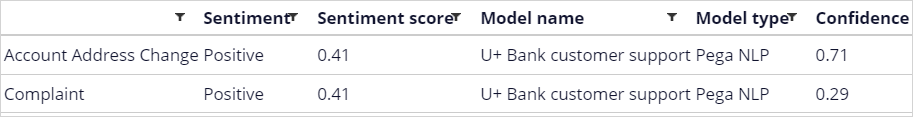
The sentiment model is shipped with the product and predicts an overall positive sentiment.
Entity extraction can be based on keywords, machine learning, or RUTA scripts.
The Data work area is used to define data sets, resources, and historical data.
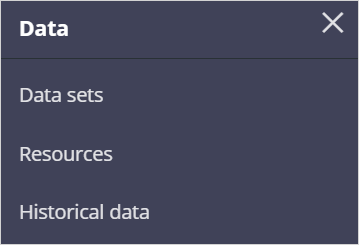
A data set instance can be sourced from a database table, from stream services, or even social media, such as Twitter and YouTube. Resources include taxonomies and the default sentiment lexicon to use in building machine learning models. When enabled, historical data used for the training of adaptive models and monitoring of predictive models is recorded for offline analysis.
In the Settings work area, you can manage general Prediction Studio settings and connect to third-party machine learning platforms.

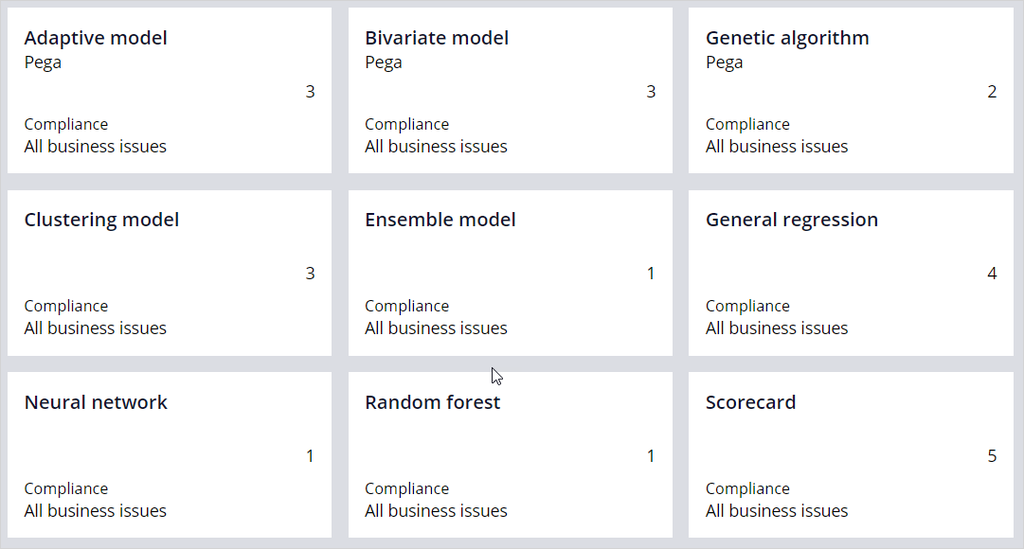
Also, you can review company policies regarding the transparency thresholds for different business issues. In risk management, decisions must be explainable. In marketing, more accurate models may be allowed at the expense of transparency.
Each model type is assigned a transparency score ranging from 1 to 5, where 1 means that the model is opaque, and 5 means that the model is transparent. Depending on the threshold setting, some types of models can be non-compliant for a specific business issue.
This demo has concluded. What did it show you?
- How to create and manage Customer Decision Hub predictions, case management predictions and text analytics prediction.
- How to create and manage the predictive models that drive the predictions.
- How to inspect the model transparency settings of the business.
This Topic is available in the following Module:
If you are having problems with your training, please review the Pega Academy Support FAQs.
Want to help us improve this content?