Distribution test
What is a distribution test simulation?
A distribution test simulation enables you to unit test a decision strategy. You can execute a simulation on an input audience, output the results to a database table and view the results using out-of-the-box simulation reports.
You can use these reports to inspect the number of actions offered in general, the number of actions across various channels, the average propensity of the actions, the ranks at which each action is offered, and so on. This is particularly useful when creating or changing an action and understanding the possible implications of that change.
Let’s look at the Proposition Distribution and Proposition Priority reports as examples of the available reports.
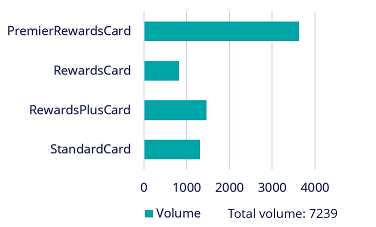
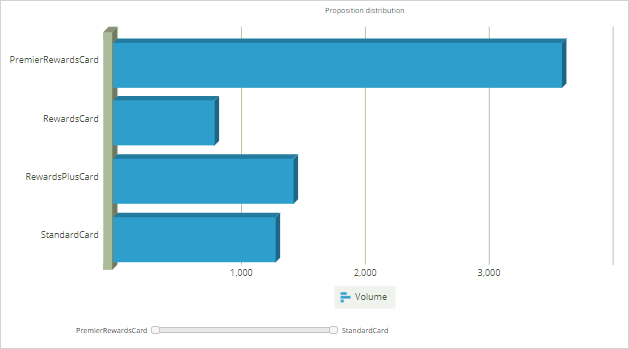
Proposition Distribution shows the volume per action. That is, how many times each action was output by the decision strategy. In the report you can also see the total volume of actions.
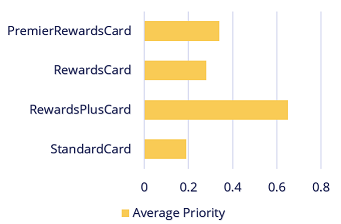
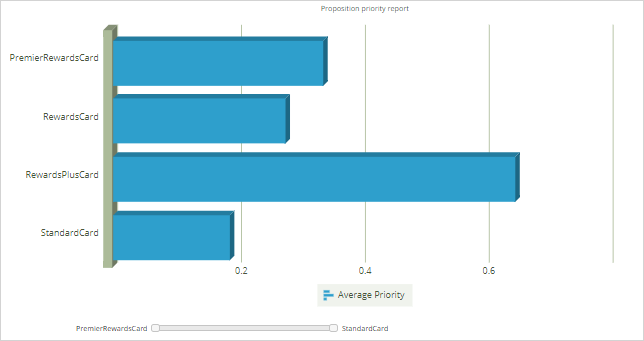
The Proposition Priority report shows the average priority of each action. Here you can see that the RewardsPlus card offer has the highest average priority, meaning the expectation is that this will be the best performing action. If an action has a low average priority, the chance of this action being offered may also be lower.
Another possible output of a distribution test is a Visual Business Director (VBD) data source. A VBD simulation is particularly useful when you want to test the effect of contact policy changes and compare the old result to the new result. Often a VBD simulation starts with a baseline run, which is run on a given audience, using the current engagement policies. It is followed by a simulation run, which is a simulation on the same audience after changing the engagement strategies. VBD delta mode helps you spot the exact differences at an action level. For example, how many more Gold credit cards are offered as a result of the change? And which card is offered less?

Analyzing results of simulations using reports
Transcript
This demo will show you how to run a simulation and output the results to a database table and view the results using out-of-the-box simulation reports.
U+, a retail bank, recently updated one of their engagement policy conditions. They would like to unit test their changes by running a distribution test to check that the overall distribution is within the desired ranges.
This is the Pega Customer Decision Hub™ portal. Navigate to the Simulations landing page to create a new Distribution test.

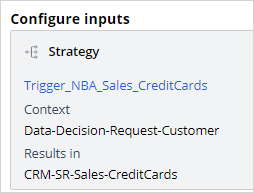
To create a simulation, select the top-level strategy on which you would like to run the simulation. Use the top-level next-best-action strategy, as this simulation pulls in data from all relevant actions and treatments.
Then, select the input population on which you want to execute the simulation.
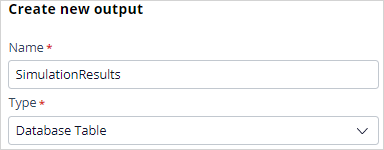
Now, rename the simulation. This will help you identify specific simulation runs easily. Next, configure the output. Create a new output destination. Give the output destination a name. You want to write the output to a database table, so select the Database Table option. Once you configure a new output destination, all the underlying artifacts are created for you (including the database table with the output columns). At this stage, you can select multiple output destinations, either another database table, or a Visual Business Director data source. For now, just continue with the SimulationResults database table. It is best practice to clear the simulation results before each run.
When one or more output destinations is a database table, you need to select which reports you want to have available for each destination. Select the output database table, then the report category, and finally one or more reports. Note that there are several out-of-the-box reports available. A decisioning architect can extend this list to create new reports specific to the business’ needs. For now, just choose two of the standard reports: Proposition Distribution and Proposition Priority Report.

Run the simulation test.
When the execution is complete, you can inspect the results of the simulation by opening the assigned reports. You can also add reports to a simulation once the run is complete to view the output written to the database. This Proposition Distribution report shows the volume of the individual actions. That is, how many times each action would be displayed to the customers. In the table you can also see the total volume at the group and business issue levels.
In contrast, the Proposition Distribution report you would see in an audience or decision funnel simulation is only the number of customers who qualify for an offer.
The Proposition Priority report shows the average priority of each action. Here you can see that the RewardsPlusCard offer has the highest average priority, meaning the expectation is that this will be the best performing action. If an action has a low average priority, it may also be offered less frequently.
This demo has concluded. What did it show you?
- How to execute a distribution test simulation.
- How to output simulation results to a database table.
- How to assign out-of-the-box reports to the simulation output.
This Topic is available in the following Module:
If you are having problems with your training, please review the Pega Academy Support FAQs.
Want to help us improve this content?