Adding a diagnostic log component to an automation
Add a diagnostic log component to an automation
Follow these steps to add a diagnostic log component to an automation.
- Ensure the necessary automation is open in a Designer window.
- Determine the existing automation design blocks between which to place the log component.
- Delete the automation link connecting the two automation design blocks.
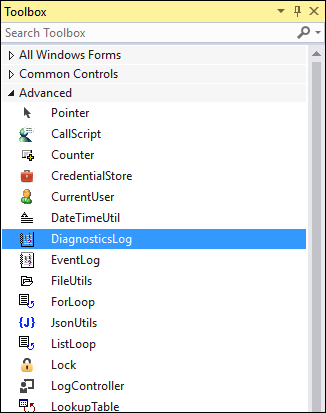
- From the Toolbox window, locate and expand the Advanced category.
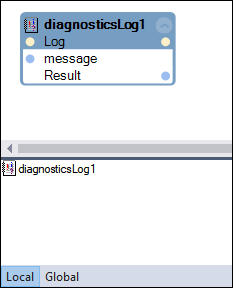
- Drag and drop the DiagnosticsLog component to the automation. A diagnosticsLog1 is displayed in the automation and on the Local variable tab.
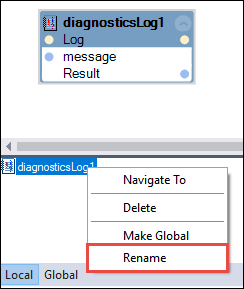
- Rename the diagnosticLog1 component based on project documentation.
Note: To name a diagnosticLog component, follow the Log_{name of the automation} naming convention.
- On the diagnosticsLog1 Design block, click message to enter the custom log file entry. You can also pass a dynamic value through the input port.
- Connect the diagnosticLog1 Design block with the automation links to the automation.
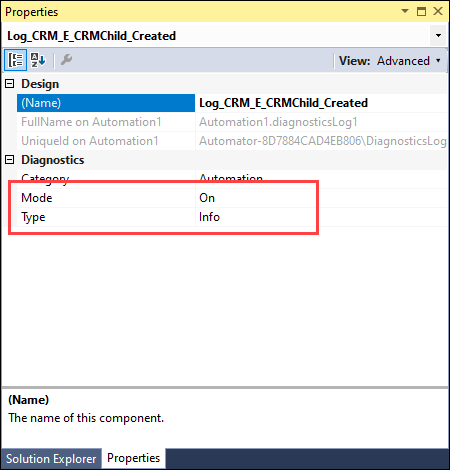
- In the Object Hierarchy, click the diagnosticLog1 object. The Properties window updates to display the log component.
- In the Properties window, modify the Mode and Type properties as needed.
- From the menu bar, click File > Save All to save your changes.
Validate the log entry
Follow these steps to validate the recorded log entry.
- Navigate to the directory where the log file exists.
Note: The default location can be identified by entering %appdata% in the address bar of File Explorer.
- Double-click the RuntimeLog.txt file to open the log file. The file can be opened in Notepad or another application.
- View the log data. the following image is an sample log file.

- Close the log file application.
This Topic is available in the following Module:
- Diagnostics v1
If you are having problems with your training, please review the Pega Academy Support FAQs.
Want to help us improve this content?