
Pega Robotic Automation Playback
Pega Robotic Automation Playback
The Automation Playback feature lets you animate the automation activities in Runtime log files so you can better see what is happening as your automations execute. Automation Playback also works with files generated with the Log4Net Publisher.
The following diagram explains the process of automation playback:
You would use this feature when other debugging methodologies do not provide the information for issue resolution. Threading is a common reason for using the playback feature; it provides information about when specific threads or contexts start and end to determine if the automation sequencing is causing an issue. You may also use this feature with other debugging methods.
Installation and configuration
The Automation Playback feature is included in Pega Robot Studio™ Automation Playback and is set up during installation. You do not need to install or configure anything.
When you install Pega Robot Studio Automation Playback, the installer makes some changes to the RuntimeConfig.xml file. If you have customized this file and prefer to add specific changes manually, you can enable the Automation Playback feature, as shown in the following image:
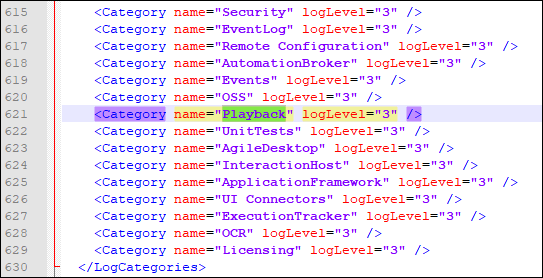
Set the Playback option to log level 3, as shown here:
<Category name="Playback" logLevel="3" />
This tells the Runtime system to include the information the Automation Playback feature needs to animate the log.
Playback window features
The Automation Playback window is displayed as a designer window in the Pega Robot Studio IDE. You may float, dock, or relocate the window to fit your needs.
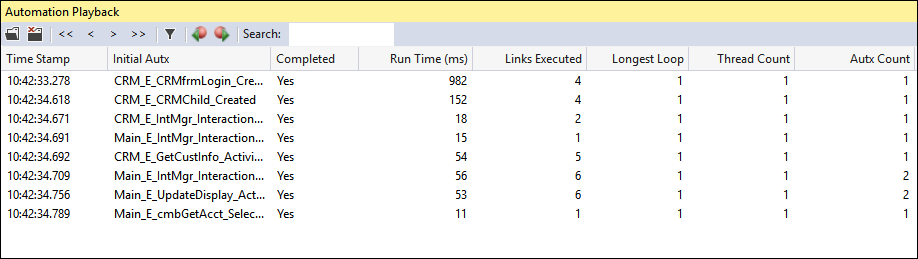
The Playback window is separated into lower and upper sections. The lower section displays the contents of the opened log file. The upper portion provides details of each played back line from the opened log file. The following table includes the upper section column descriptions:
| Column | Description |
| Time Stamp | This is the time at which Automation Playback started playing back this link. |
| Initial Autx | This is the name of the first automation that was run. |
| Completed | This lets you know if the system was able to complete the processing of an automation and return. Use this status to determine which automation failed. |
| Run Time (ms) | This is the amount of time, in milliseconds, it took to process the link. |
| Links Executed | This is the total number of links that were executed. |
| Longest Loop | This is the number of iterations in the longest loop. |
| Thread Count | This is the number of threads started. Typically, this should be a low number. If the automation has spawned a high number of threads, you should check the automation and reduce the number of threads. |
| Autx Count | This is the number of automations used within the execution context. |
These column definitions describe a single execution context.
The Playback toolbar includes the following options to navigate through the log file automation entries.
| Click | Or Press | Description |
|
Open Log File |
Click to display the Open dialog so you can select the log file you want to run. The system defaults to the RuntimeLog.txt file. | |
|
Close File |
Click to close the log file currently loaded. | |
|
First |
Ctrl+Shift+ Up Arrow | Click to go to the first entry in the log file. |
|
Back |
Ctrl+Up Arrow | Click to step backwards one entry. |
|
Next |
Ctrl+Down Arrow | Click to step forward one entry. |
|
Last |
Ctrl+Shift+ Down Arrow | Click to go to the last entry in the log file. |
|
Playback Selected Context Only |
You can toggle this tool on or off. If it is toggled on, the Playback window only steps through the links in that Execution Context. Filtering lets you stay on the same automation path, as opposed to changing to a different path when another automation starts. | |
|
Skip to Previous Breakpoint |
Click to go back to the previous breakpoint. | |
|
Skip to Next Breakpoint |
Click to jump forward to the next breakpoint. | |
| Search | Search for text in the log file. Once the text is found, press Enter to go to the next match. You can press Shift+Enter to go to the previous match. |
Alternative navigation options
Log files can be long and contain thousands of line entries. This depends on the configuration of the diagnostic settings found in the RuntimeConfig.xml file for both Studio and the user's Runtime application.
The Playback feature provides a quick alternative navigation option that allows you to jump to specific points in the log file.
When you open a log file from the Playback window in Studio, the automation entries are displayed in the upper portion of the Playback window. You have two navigation options from which to choose:
- Double-click an automation line in the upper portion. The playback moves to the initial link of that automation. You may step through the individual links using the Playback toolbar icons.
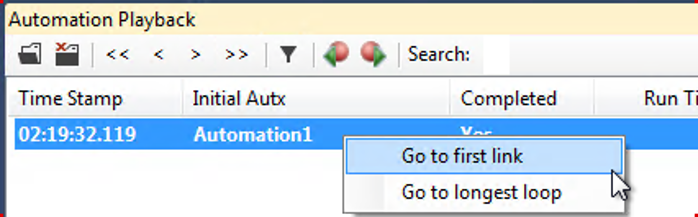
- Right-click an automation line in the upper portion. A context menu displays prompting for a navigation option.
| Option | Description |
| Go to first link | This takes you to the first link in the highlighted automation. |
| Go to longest loop | This takes you to the longest loop Automation Playback encountered when playing back the log file. |
This Topic is available in the following Module:
- Diagnostics v1
If you are having problems with your training, please review the Pega Academy Support FAQs.
Want to help us improve this content?