Analyzing the effect of business changes using Pega Scenario Planner
Pega Scenario Planner allows you to easily simulate “what-if” scenarios to accurately forecast results, optimize strategies to hit specific goals, and explore the potential trade-offs of each option.
Video
Transcript
This demo shows you how to use Scenario Planner to increase your understanding of the effect of business changes.
U+ Bank, a retail bank, has recently implemented a project in which credit card offers are presented to qualified customers when they log in to the self-service web portal. The bank wants to understand the opportunity cost or gain in using levers to adjust AI prioritization.
You can use Scenario Planner to analyze the opportunity cost or gain associated with applying levers. Scenario Planner also lets you understand the scope, to optimize for increased revenue, and trade-offs from adjustments due to levers.
This is the Pega Customer Decision Hub™ portal.
To analyze the simulations using Scenario Planner, you first need to run an audience simulation using the engagement policies and arbitration as the scope, with second-pass simulation enabled.
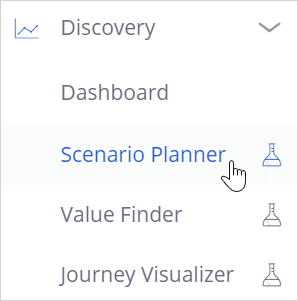
In the navigation pane click Discovery to open the Scenario Planner and analyze one or more simulations..
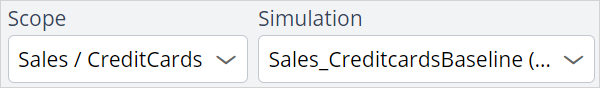
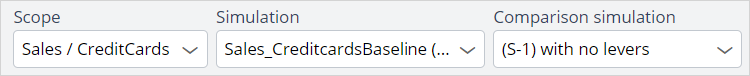
Select the scope of the run. The scope can be at all the issues level or for a particular issue and group. In this case, select the Sales issue and the CreditCards group. Now, select the audience simulation run that you executed earlier.
You can also select a simulation without levers or another audience simulation for a different next-best-action configuration and compare the results in general or for specific channels. For now, apply to view the results.
A Scenario Planner simulation displays metrics that show the projected value capture based on the configurations within Next-Best-Action Designer, the actual responses from the interaction history, and the projected reach and responses calculated from the results of the audience simulation.
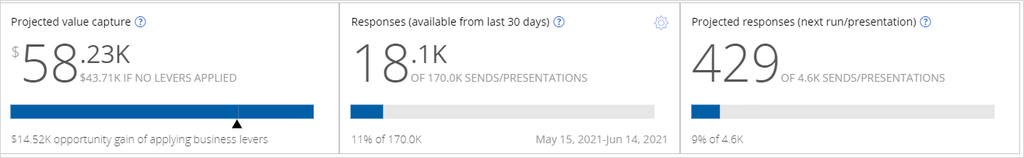
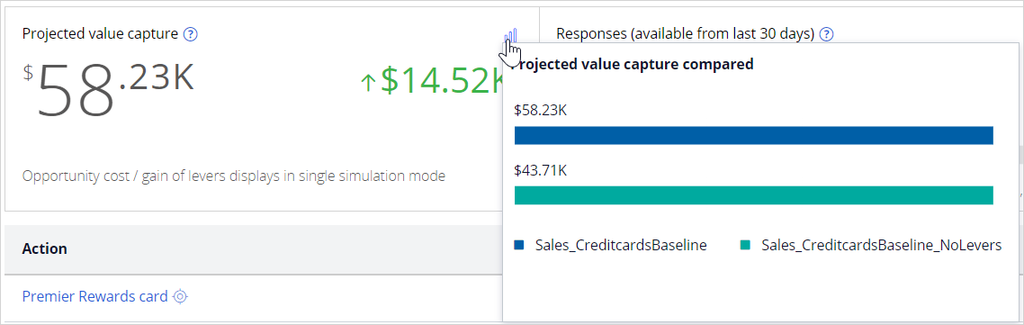
In this tile, you see the projected value that represents the estimated value that the upcoming next-best-actions (outbound run and inbound impressions) bring with the currently-selected configuration and the opportunity cost or gain of applying the levers. Prioritizing a specific action by increasing its business weight can result in increased value but often comes at the expense of the projected value capture for other actions, issues, and groups.
In this example, the pointer is under the bar, as there is an opportunity gain when levers are applied.
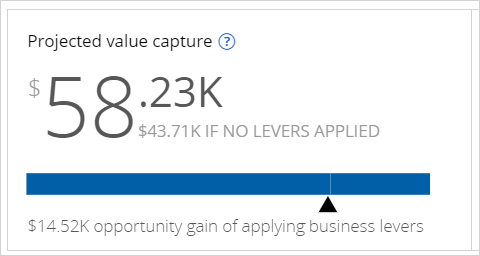
The projected value capture is $43.71K without levers, represented by the blue bar until the pointer. In addition, there is a $14.52K increase in value due to the implementation of business levers, amounting to a total of $58.23K projected value capture.
If there is an opportunity cost involved, the bar in this section has a grey portion. The pointer in that area indicates a scope for value increase without levers.
This tile shows the number of accepted actions versus the aggregate number of outbound sends and inbound impressions over the last 30 days. That is, the actual or historical accepts and presentations versus the number of times an action was sent or presented to customers. In this case, there are 18.1K accepts out of 170K impressions.
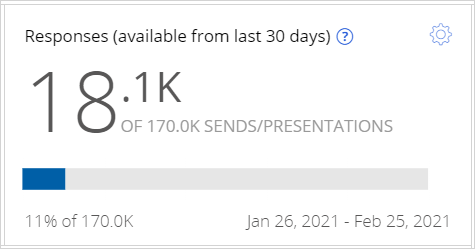
You can change the timeframe for historical data from the last 30 days to the last 60, 90, 180, or 365 days. You can also aggregate data from the last full quarter up to a full year.
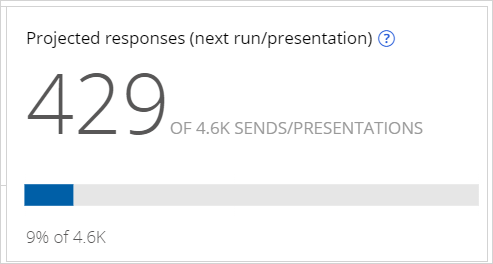
In this tile, you see the aggregate number of sends or impressions, with the projected accepts, that the next outbound run or presentation will accumulate with the currently selected configuration. The business can expect 429 accepts out of the 4.6K sends or presentations. This value is calculated based on the audience simulation run results.
The following table displays the results per the selected simulation, issue, group, action, and channel. In this case, you see the results for the actions in the CreditCards group.
The table provides the number of actual responses per card for the selected time frame, the projected reach of each card (that is, how many times a card is sent or presented to customers), and the projected responses for each card (the number of accepts that are expected for each card).
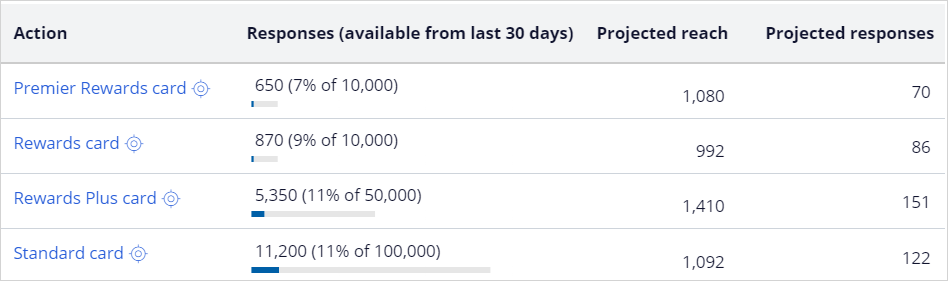
For example, if the Premier Rewards card is sent or presented 1,080 times to customers, it is likely that 70 customers might accept the offer.
You can also analyze the opportunity cost or gain of each action.
Now, select the audience simulation without levers and compare the results.
Note that in comparison mode, the Scenario Planner indicates the projected value and reach in green, as there is an increase when the lever is applied.
You can click the individual section menu to view the projected data comparison.
Similarly, in the table, the projected reach and responses are indicated per action with a green and red arrow to show which action is presented more and which action is presented less due to the business lever implementation. This information gives the business an idea of how well the actions might perform and how to decide on their trade-offs and prioritizations.
Now, navigate to the Results tab of the action without levers to view the effect on the business. Notice that there might be an opportunity cost if the levers are not applied. Also, the projected response is lower, leading to an increase in low-performing actions.
In this case, the business can see how implementing business levers might increase its revenue by presenting the right offers to the right customers.
Scenario Planner enables you to export the results to a CSV file for detailed analysis.
The CSV of the comparison simulation contains the deltas for all the values and metrics color-coded for each simulation, similar to the UI. Also, the CSV file contains the simulation data for each of the simulations.
The CSV file of the single simulation has a single view sheet that shows all the values and metrics, as did the Scenario Planner simulation result.
You have reached the end of this demo. What did it show you?
- How to analyze simulations using Scenario Planner
- How to compare simulations using Scenario Planner
- How to interpret the effect of business changes
- How to export and analyze the simulation results
This Topic is available in the following Modules:
If you are having problems with your training, please review the Pega Academy Support FAQs.
Want to help us improve this content?