Pega Scenario Planner
Pega Scenario Planner enables users to analyze simulation runs to determine how close the results are to meeting expected targets. Using Scenario Planner, you can browse the results of past next-best-action audience simulations on one page and compare the results to real outcomes in a simple, transparent interface. Also, you can view the results for all issues and groups or drill down to the details of a single action and channel. This view is useful when planning new changes or optimizing existing parameters.
Video
Transcript
This video explains how Scenario Planner enables a business to meet its business priorities.
Scenario Planner allows you to easily simulate “what-if” scenarios to accurately forecast results, optimize strategies to hit specific goals, and explore the potential trade-offs of each option.
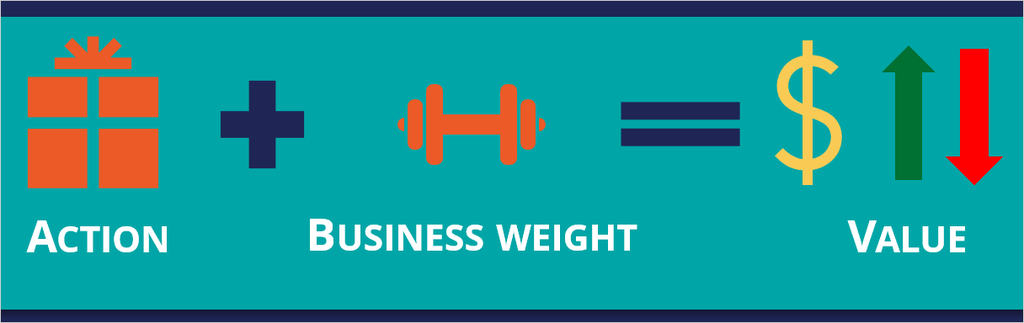
Scenario Planner also estimates the value that the subsequent next-best-action run creates using its current configuration. For example, you can observe whether prioritizing a specific action by increasing its business weight might result in an opportunity gain or an opportunity cost.
The Scenario Planner landing page shows three useful Key Performance Indicators: projected value capture, responses from Interaction History (including accepts, sends, and impressions), audience simulation counts (or projected reach), and projected accepts based on adaptive models.
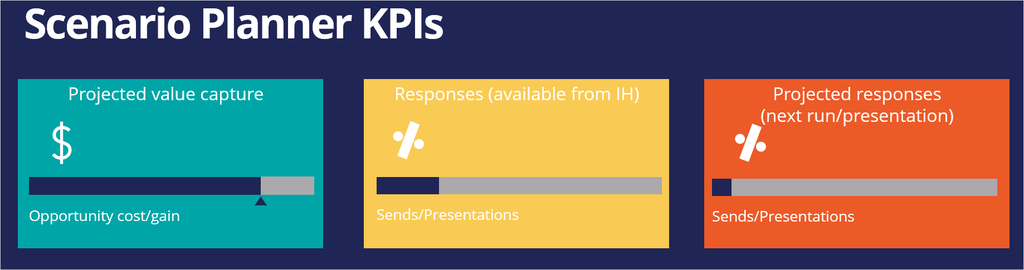
Depending on the selected filters, the Scenario Planner view can display the results for a specific channel, action, group, or issue.
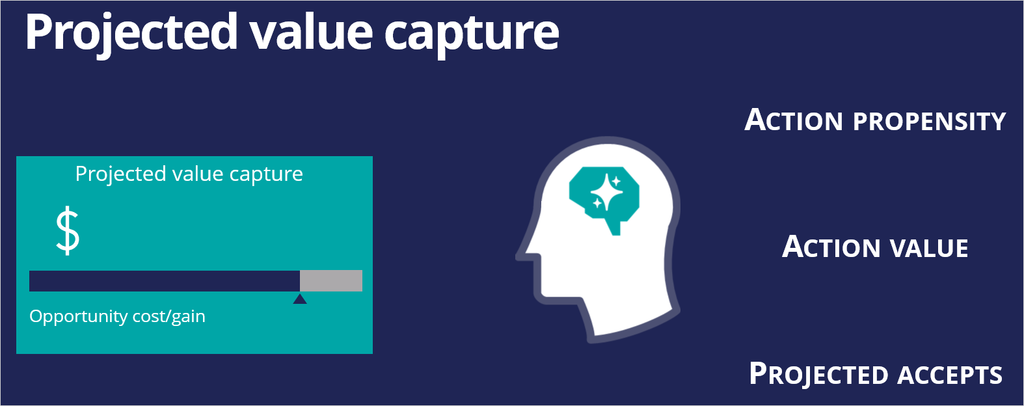
The projected value capture represents the estimated value that the upcoming next best actions (outbound run and inbound impressions) will bring with the currently selected configuration and the opportunity cost or gain of making changes to the Next-Best-Action Designer configuration.
The projected value capture is calculated using the action propensity, the action value of the top offer for each customer in the sample audience, and the projected accepts.
Here is an example of how the projected value capture is calculated.
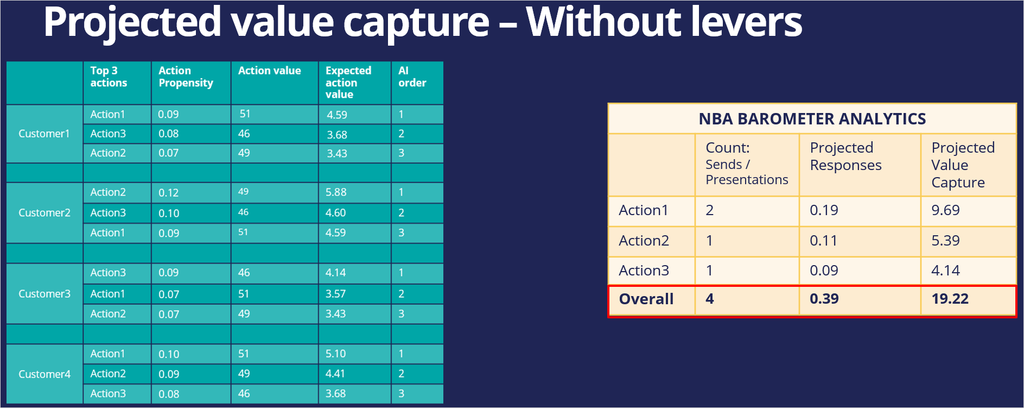
Consider Customer1, who qualifies for three actions. The action propensity of each action is determined by the Artificial Intelligence (AI) engine. Also, the business has assigned an action value for each action.
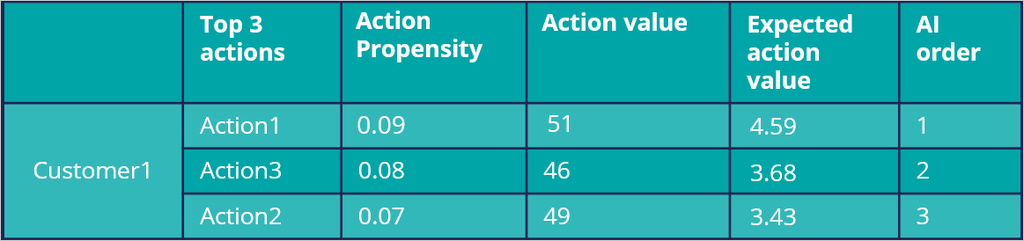
With the action propensity (p) and the action value (v), the expected action value is computed using the formula p*v. The expected action value is the anticipated average revenue that the business is likely to make from an action.
For example, if an action has a propensity of 0.09, and a business value of 51, the expected value of the action is 0.09*51 = 4.59. If the business value is not assigned for an action, the value is considered 1 by default.
The AI ranks the actions based on the expected action value. That is, the higher the expected action value, the better the rank.
Simulations are usually executed on a set of customers, also referred to as the audience. Similar to the first customer, the action details of all other customers are computed.
In this scenario, where there are no levers, the projected value capture is calculated by using the number of times an action is a top offer and the projected accepts. In the example, Action1 is the top offer for two customers. As a result, the projected accepts is the sum of the action propensities. That is, 0.09 + 0.10 = 0.19.
This value means that the expected value capture for Action1 is the sum of the expected action value for Customer1 and Customer4. That is, 4.59 + 5.10 = 9.69. The projected value capture is the overall sum of the actions’ expected value capture.
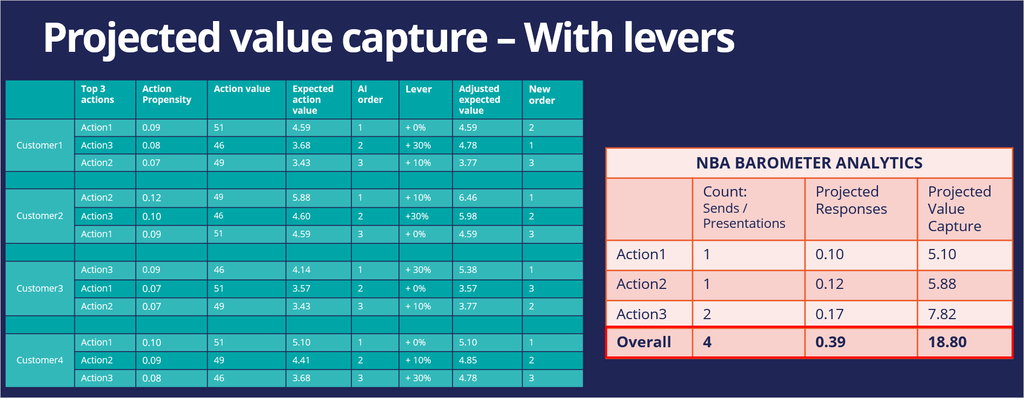
Now, consider another situation where the business has assigned levers to the actions to boost them based on the business requirement. For example, the business has assigned a business lever of 0%, 30%, and 10% to Action1, Action3, and Action2, respectively.
Applying levers affects the expected value and the action ranking. The adjusted expected value of the action is calculated using the formula, p*v*l. That is, the propensity times the value times the lever. For example, if an action has a propensity of 0.08, an action value of 46, and a lever of + 30%, the new expected value of the action is 4.78.
Based on the adjusted expected value, the order of the actions changes. Notice that Action3 becomes the top 1 action for Customer1.
Similarly, the adjusted expected value is determined for all the other customers in the sample audience.
As in the first example, the expected value capture and the projected accepts are calculated using the number of times an action is the top offer, taking into account the new order. Per the example, Action1 is the top offer for Customer4 only. As a result, the projected accepts is 0.10.
This value means that the expected value capture for Action1 is the same as the expected action value for Customer4, 5.10. The projected value capture is the overall sum of all actions’ expected value capture.
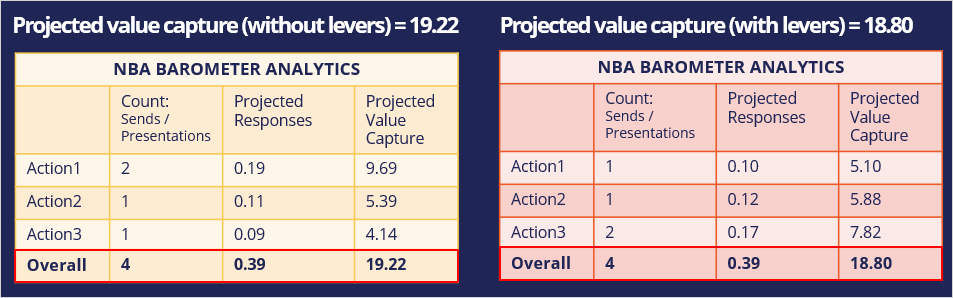
Note the projected value capture for each scenario. The projected value capture without levers is more than with levers. That is, if the levers are applied, there is an opportunity cost involved. If the projected value capture without levers is lower, there is an opportunity gain involved.
The Scenario Planner results help a business adjust Next-Best-Action Designer based on the metrics to meet its business priorities.
Pega Scenario Planner enables you to:
- Analyze simulation runs to understand how the business is performing
- Understand the opportunity cost or opportunity gain involved in adjusting the Next-Best-Action Designer configurations
This Topic is available in the following Modules:
If you are having problems with your training, please review the Pega Academy Support FAQs.
Want to help us improve this content?