Configuring an adaptive model
Explore how AI-based arbitration works for the website that U+Bank uses as a marketing channel to recommend more relevant banner ads to customers when they visit their personal portal.
As a data scientist, you can optimize the prediction that drives the decision of which banner to show to a customer by adding clickstream summaries that extend the customer profile with real-time behavioral data as potentially relevant predictors.
Video
Transcript
This demo explores how AI-based arbitration works and shows you how to configure additional potential predictors for an adaptive model.
U+ Bank implements cross-selling of their credit cards on the web by using Pega Customer Decision Hub™ to show a credit card offer in a web banner when a customer logs in to their account. The arbitration settings are defined in the Next-Best-Action Designer of Customer Decision Hub.
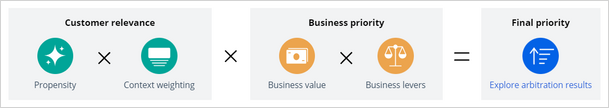
Arbitration aims to balance customer relevance with business priorities to decide which offer to show to the customer. To achieve this balance, numerical values that represent propensity, context weighting, business value, and business levers are multiplied to arrive at a prioritization value, which determines the top actions.
Propensity is the predicted likelihood of a customer showing the target behavior, in this case, clicking a web banner. The Predict Web Propensity prediction calculates the propensity. The Web_Click_Through_Rate adaptive model drives this prediction. The model calculates the propensity for each credit card offer for which a customer is eligible.
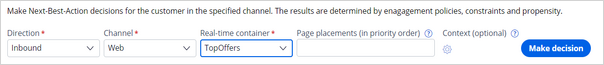
So, let's see what is the next best action for customer Troy. For the current use case, the direction is Inbound, and the channel is the Web. TopOffers is the real-time container service that manages communication between Customer Decision Hub and the website of the bank.
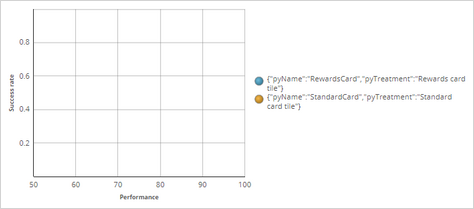
When you request a decision for Troy, the Customer Profile Viewer shows you the offers for which Troy is eligible. Based on business rules, Troy is eligible for two credit card offers: the Rewards Card and the Standard Card.
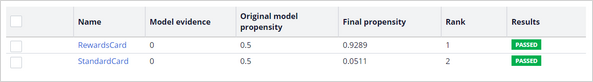
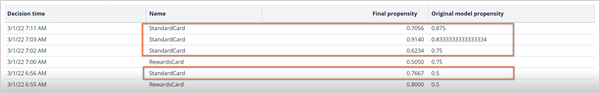
When the first request for a decision comes in through the TopOffers service, Customer Decision Hub creates an adaptive model instance for each of these offers. When created, the model evidence is zero as no responses have been captured yet. With zero evidence, the original model propensity is 0.5, or the flip of a coin.
The final propensity that is used in the prioritization formula deviates from the original model propensity as it depends not only on the original model propensity but also on a mechanism that introduces noise while the evidence is low. The noise decreases as the model learns from the target and alternative responses, and the original model propensity and the final propensity converge. This mechanism assures that new actions receive exposure even when their models are still immature.
For outbound models, an action is initially presented to only 2% of the population to minimize the possibility of customers receiving irrelevant offers. This percentage increases during the maturation of the model to 100%. A model is considered mature after it has received at least 200 positive responses.
The Predict Web Propensity is the Customer Decision Hub prediction that calculates the final propensities for each combination of action and treatment in the inbound web channel.
The adaptive model calculates propensities for most customers, but a small subset of customers is in the control group. For this group of customers, the prediction generates random propensities.
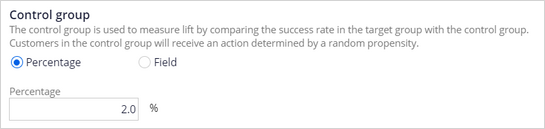
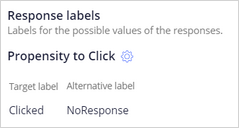
By comparing the success rate of model-based actions to random actions, you can see the impact of AI. The ratio of the success rate in the majority group and in the control group is called lift, and lift is an important KPI. The use of a control group also enables the models to explore alternative offers and remain flexible. The target response has a Clicked label by default. For the alternative response, the label is NoResponse.
You can use additional response labels when an outcome has multiple possible labels. For example, when a channel passes multiple labels for the same outcome.
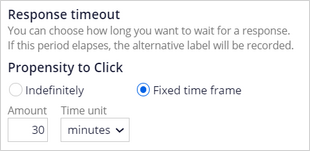
The Response timeout setting determines how long the system waits for a response from the customer after the impression. In a web scenario, the response timeout is 30 minutes by default, but an outbound channel requires a response timeout of several days to provide customers with enough time to respond to the message.
The Web_Click_Through_Rate adaptive model drives the prediction. The decision request for Troy in Customer Profile Viewer prompts the creation of adaptive model instances for the combination of the Standard Card and Rewards Card offers and their inbound web treatments.
An adaptive model instance is a self-learning, online predictive model that uses machine learning to calculate propensity scores.It automatically determines the data fields that help to predict customer behavior. Predictors can be one of two types: numeric or symbolic. The system uses the property type as the default predictor type during the initial set-up, but you can change the predictor type. For example, when you know a numeric predictor has a small number of distinct values, such as when the contract duration is either 12 or 24 months, change the predictor type from numeric to symbolic.
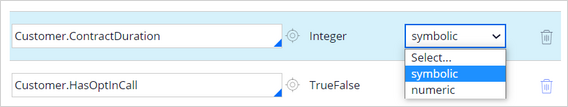
Keep in mind that changing the predictor type effectively means removing and adding a predictor. A best practice is to make these changes early in the process, as there is no way to retain previous responses.
As a data scientist, you can enhance the model by adding additional fields. It is highly recommended to add many uncorrelated predictors, as the models figure out which ones to use. Additional predictors can include customer behavior, contextual information, past interactions with the bank, and even scores from external models. The FSClickstream page represents customer behavioral data that the system architect recently introduced.
The Interaction History (IH) dataset captures the customer responses. Aggregated fields from IH summaries are automatically provided to the models as predictors. IH summaries leverage historical customer interactions to improve the predictions.
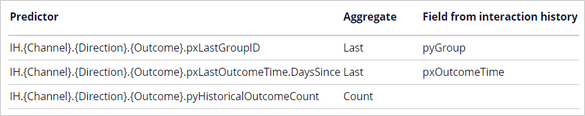
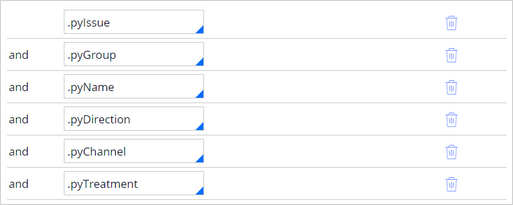
An example of a predictor is the group of the most recently accepted offer in the call center with the naming convention IH.CallCenter.Inbound.Accepted.LastGroup.
The model update frequency determines the number of responses that triggers an update of the adaptive model instance.
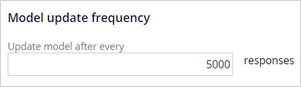
As a best practice, configure the Model update frequency so that model instances update every 2-4 hours on average. The default setting is 5000, which is suitable for a web banner with around 40 impressions per minute. Additionally, a model update occurs at least every 12 hours to ensure all recorded responses are regularly processed.
You can save historical customer responses to the offers for offline analysis in a repository.
The default values for the advanced settings in an adaptive model are based on best practices. Only a highly experienced data scientist should change the default values. By default, the system uses all received responses for each update cycle, which suits most use cases. The option to use a subset of responses assigns additional weight to recent responses and increasingly less weight to older responses when updating a model.
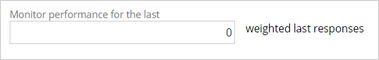
The Monitor performance for the last field determines the number of weighted responses the model performance calculation uses for monitoring purposes. The default setting is 0, which means that the calculation uses all historical data.
Additional parameters determine the binning of the responses.
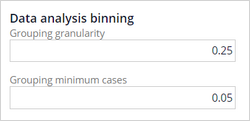
The Grouping granularity field determines the granularity of the predictor binning. A higher value results in more bins. The Grouping minimum cases field determines the minimum fraction of cases for each interval. The default setting is 5% of the cases. Together, these two settings control the grouping of predictors by influencing the number of bins. A higher number of bins might increase the performance of the model, but the model might also become less robust.
The system activates predictors that perform above a threshold. Over time, the system dynamically activates or deactivates the predictors when they cross the threshold.
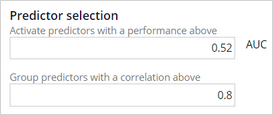
Area Under the Curve (AUC) is a measure of the model performance of the predictor. It tells how well the predictor can distinguish between classes. The minimum AUC value is 0.5, so the value of the performance threshold should always be above 0.5.
The system considers pairs of predictors with a mutual correlation above a threshold as similar, groups them, and uses only the best predictor in a group for adaptive learning.
To test the adaptive learning on target behavior, log into the U+Bank website as Troy and click the web banner. In the Customer Profile Viewer, after repeatedly logging in as Troy and clicking on the web banner each time, you see that the Original model propensity goes up when a target response is recorded.
Likewise, when Troy repeatedly ignores the offer, alternative responses are recorded after the Response timeout elapses.
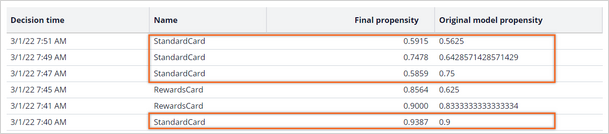
Consequently, the Original model propensity for Troy and customers like Troy decreases.
You have reached the end of this video.. What did it show you?
- How to request a decision for a customer in Customer Profile Viewer.
- How to configure additional potential predictors for an adaptive model.
- How to explore the original model propensities and the final propensities in Customer Profile Viewer.
This Topic is available in the following Module:
If you are having problems with your training, please review the Pega Academy Support FAQs.
Want to help us improve this content?