Debugging automation data values
You can spot automation logic or errors quickly when watching and analyzing data values during the debugging process. For example, you cycle through a table of data looking for specific values in a cell and then copy the data from that row to another system. You want to check the values while debugging to ensure that the automation skips the unnecessary rows and copies the correct row. Pega Robot Studio provides three options with which you can check data values during debugging:
- Automation Locals
- Automation Watches
- Data port tooltips
Your project requires at least one enabled breakpoint to review any of these options.
Automation Locals
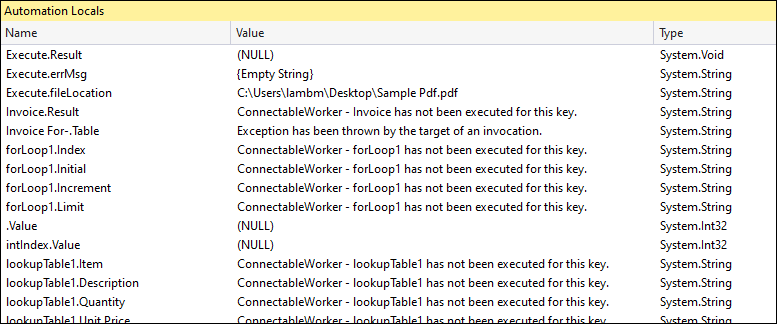
The Automation Locals window displays all the active data ports on the open, active automation during the debugging process. You access the Automation Locals window from the menu bar by clicking Debug > Windows > Automation Locals only while debugging.
An automation requires at least one breakpoint to display in the window. You can also use the locals displayed to navigate while the debugger is active. By clicking on a specific item, you can move directly to its area in the automation. The following figure shows the Automation Locals window with all design blocks with data values either completed or waiting for completion:
Automation Watches
In Pega Robot Studio, you can monitor selected data ports during the debugging process by using Watches. You can use watches to monitor data that is not tied to the Locals window.
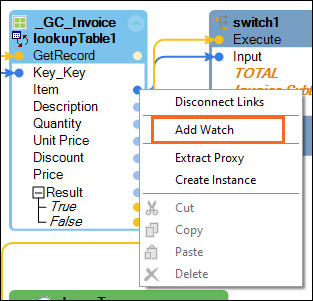
To add a watch, right-click the data port on a property you want to monitor, and then select Add Watch. To remove a watch, from the Automation Watches window, select the watch and press Delete.
You open the Automation Watches window from the menu by selecting Debug > Windows > Automation Watches. This menu is available only during debugging.
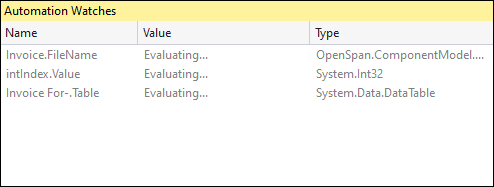
The system lists the name of the watch, along with its value and type in the Automation Watches window, as shown in the following figure:
Data port tooltips
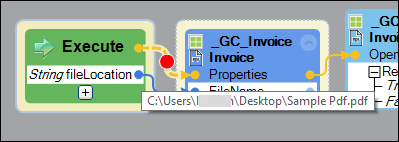
During the debugging process, you might need to perform a spot check on a data value instead of watching the Automation Locals or Automation Watches windows. You can hover your pointer over the data port of a design block to perform a quick data check. A tooltip is displayed that describes the current value at that specific time of the automation process. For example, in the image below, the automation has stopped on the automation link from the Execute. Placing the mouse over the data port for the fileLocation value, the directory of file is displayed in a tooltip.
Check your knowledge with the following interaction:
This Topic is available in the following Module:
- Debugging v1
If you are having problems with your training, please review the Pega Academy Support FAQs.
Want to help us improve this content?