Creating an Insight
2 Tasks
15 mins
Scenario
Stakeholders would like to know the number of cases that have been requested over the past month. You have been asked to define a report to track the status of Assistance requests over the last 30 days. Create a table-based insight and a chart-based insight that display the number and status of requests submitted in the past 30 days.
Note: Before you begin, generate 10-15 case instances with varying case statuses.
The following table provides the credentials you need to complete the challenge.
| Role | User name | Password |
|---|---|---|
| Application Developer | author@gogoroad | pega123! |
Note: Your practice environment may support the completion of multiple challenges. As a result, the configuration shown in the challenge walkthrough may not match your environment exactly.
Challenge Walkthrough
Detailed Tasks
1 Create a new table-based insight
- In the Pega instance for the challenge, enter the following credentials:
- In the User name field, enter author@gogoroad.
- In the Password field, enter pega123!.
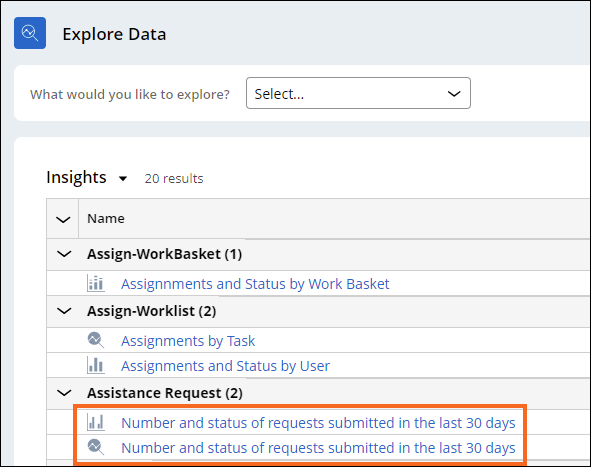
- In the navigation pane of App Studio, click Explore Data to display the Explore Data landing page.
- Click the What would you like to explore? list, and then select Assistance Request to display data related to Assistance request cases.
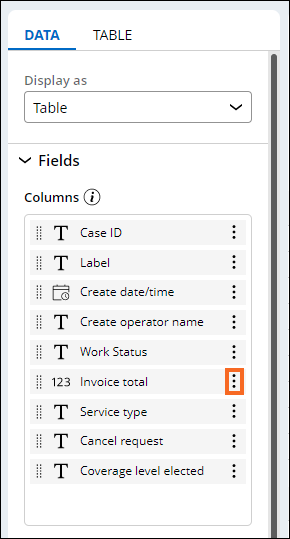
- In the Data tab, in the Columns section, to the right of Invoice total, click the More icon, and then click Remove to hide the column.
- Repeat step 4 for the Cancel request and Coverage level elected columns.
- In the Available fields pane, drag the Work status field to the Data tab, and then drop it in the Groups section.
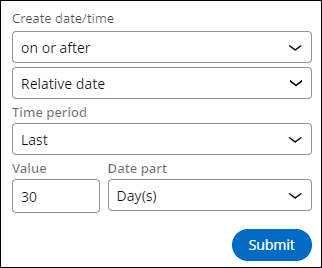
- In the Available fields pane, drag the Create date/time field to the Data tab, and then drop it in the Filters section.
The system displays a dialog box.- In the first Create date/time list, select on or after.
- In the second Create date/time list, select Relative date.
- In the Time period list, select Last.
- In the Value field, enter 30.
- In the Date part list, keep the default value of Day(s).
- Click Submit.
- Click Save as insight to display the Save as insight window.
- In the Name field, enter Number and status of requests submitted in the last 30 days.
- In the Visibility list, select Public.
- In the Description field, enter Assistance request cases for the past 30 days summarized in a table.
- Click Submit.
2 Create a chart-based insight
- In the Number and status of requests submitted in the last 30 days insight, click the Edit button.
- On the Data tab, in the Display as list, select Column.
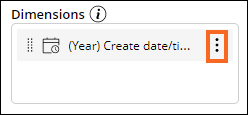
- In the Available fields pane, drag the Create date/time field to the Data tab, and then drop it in the Dimensions section.
- Click (Year) Create date/time action, and then Day to display the number of cases for each day.
- Drag the Work Status field to the Dimensions section, below (Day) Create date/time.
Note: The order of fields matters. In this example, the number of cases is first grouped by Create date/time, then by Work status.
- In the Display as list, select Clustered Column to display both the number of cases by Create date/time and by Work status.

- Confirm that the Filters section has a filter called Create date/time >= Last 30 days.
- Click Actions > Save as to display the Save as insight window.
- In the Name field, enter Number and status of requests submitted in the last 30 days.
- In the Visibility list, select Public.
- In the Description field, enter Assistance request cases by day and work status for the past 30 days displayed in a Clustered column chart.
- Click Submit.
Confirm your work
- In the Explore Data landing page, in Insights > Assistance Request, confirm there are two insights named Number and status of requests submitted in the last 30 days: one displays the chart icon and one displays the table icon.
- Click Number and status of requests submitted in the last 30 days with the table icon. The table-based insight is displayed.

- Click Number and status of requests submitted in the last 30 days with the chart icon. The chart-based insight is displayed.
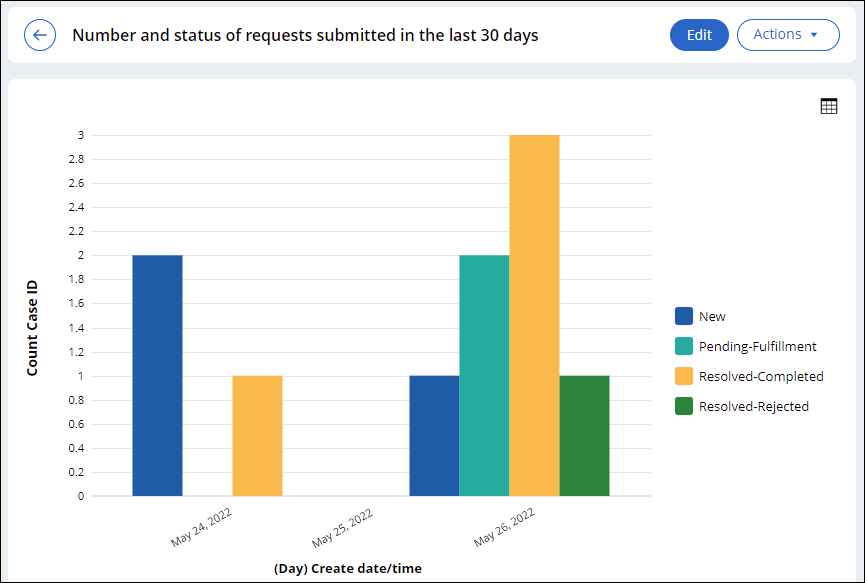
- Hover over a column to display a tooltip with the number of cases.
- Click a column to open a table view with more information about the relevant cases.
This Challenge is to practice what you learned in the following Module:
Available in the following mission:
If you are having problems with your training, please review the Pega Academy Support FAQs.
Want to help us improve this content?