Analyzing simulation results using reports
Introduction
Pega Customer Decision Hub enables you to output the result of a simulation run to a database table and assign out-of-the-box reports to the simulation output to analyze the results.
Video
Transcript
This video will show you how to simulate interactions with 20,000 customers, output the results to a database table and view the results using out-of-the box simulation reports.
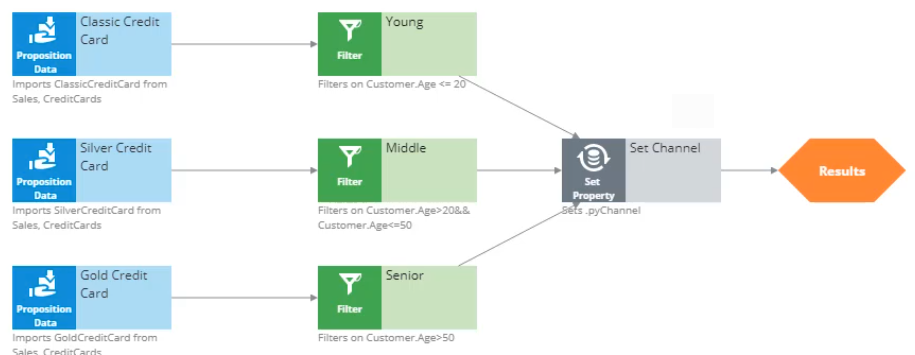
The decision strategy currently in production selects one of three credit card propositions: Classic, Silver and Gold. It then applies eligibility criteria based on Age.
To create a simulation, click on Actions ->Simulate.
First, select the input population on which you want to execute the simulation.
Next, configure the output. Select ‘Create new’ to create a new output destination.
Give the output destination a name.
You want to write the output to a database table, so select the Database Table option.
Once you click Done, all the underlying artifacts are created for you (including the database table with the output columns).
At this stage, you can select multiple output destinations. Either another database table, or a Visual Business Director data source. For now, just continue with the SimulationResults database table.
As a best practice, clear the simulation results before each run.
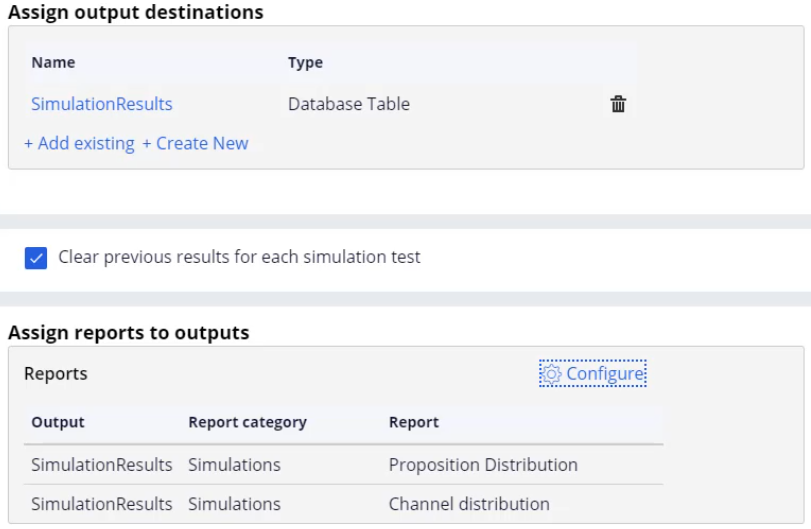
When one or more output destinations is a database table, you need to select which reports you want to have available for each destination.
Select the output database table, then the report category, and finally one or more reports.
Note that there are several out-of-the-box reports available. A system architect can extend this list to create new reports specific to the business’ needs.
For now, just choose two of the standard reports: Proposition Distribution and Channel Distribution.
Once the output reports are configured, you can save and execute the simulation test.
When the execution is complete, you can inspect the results of the simulation by opening the assigned reports.
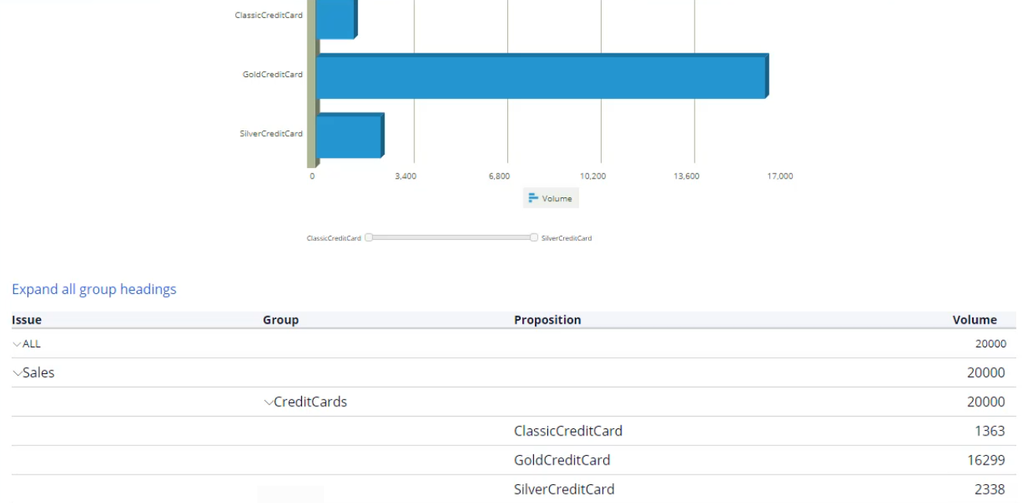
Proposition Distribution shows the volume of the individual propositions. In the table you can also see the total volume at the Group and Business issue levels.
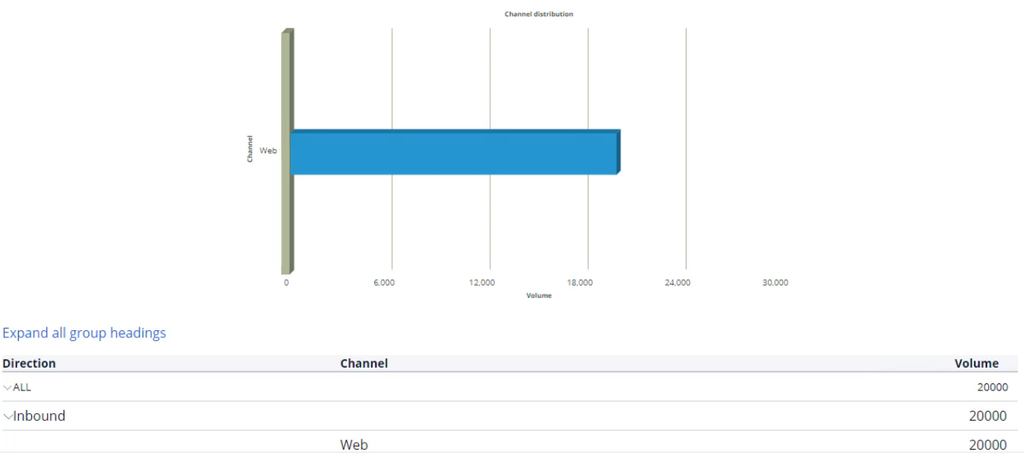
The other report, Channel Distribution, shows the volume of propositions for a specific channel.
This video has concluded. What did it show you?
- How to execute a simulation.
- How to output simulation results to a database table.
- How to assign out-of-the-box reports to the simulation output.