Analyzing simulation results using Visual Business Director
Introduction
Pega Visual Business Director (VBD) offers real-time visibility into the impact your strategies have on key business goals. Run strategy simulations to visualize how your customer strategies affect things like the customer experience, productivity, revenue generation and risk. Learn to analyze simulation results to determine which parameters need to be tweaked to optimize the effectiveness of your decision strategies.
Video
Transcript
This video will show you how to test a decision strategy by simulating interactions with 20,000 customers.
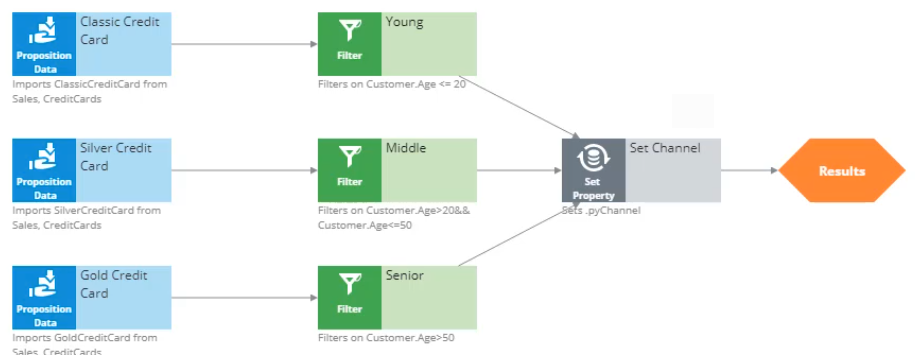
The decision strategy currently in production selects one of three credit card propositions: Classic, Silver, and Gold. It then applies eligibility criteria based on Age.
Begin your test by creating a new simulation run.
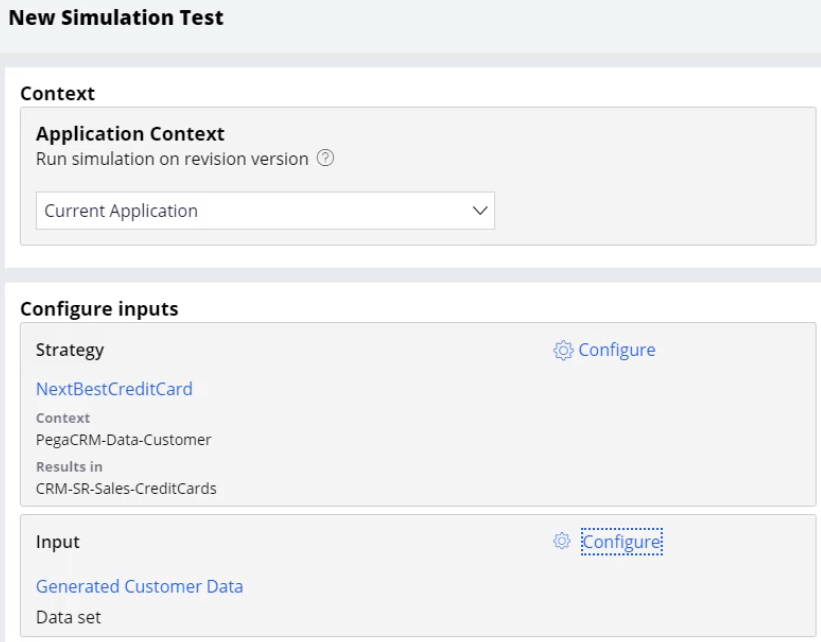
This is the simulation test screen. Here you configure the input population for your simulation, as well as where to store the results.
First, select the input population.
The input population represents the data on which you want to test the strategy. This input data can take the form of a Report definition, Data flows, or Data sets. For now, select the Generated Customer Data data set, which represents a Monte Carlo data set.
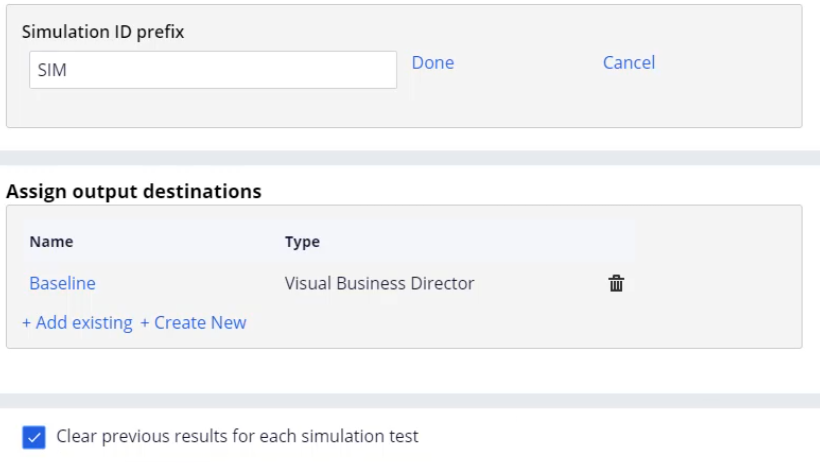
The Simulation ID prefix is an internal identifier for the test runs. For convenience, select a short value.
In Assign output destinations, configure where you want to store the simulation results. It can be in one or more destinations. For now, you are only interested in analyzing the results in Visual Business Director, so create the output destination with that as the Type.
The name you provide becomes the data source name in Visual Business Director.
If you want to re-execute this simulation, it is common practice to clear up previous simulation results before each execution.
You have completed all the configuration steps. You can now save your test configuration or save and start the execution of the simulation right away.
Once the simulation has started, you can monitor its progress and inspect the details of the run.
The simulation test execution is a data flow execution. This data flow is automatically generated once you configure a simulation test. Here you can see the time spent on every component of the data flow. Reading the input data. Executing the decision strategy. Writing results to the output source.
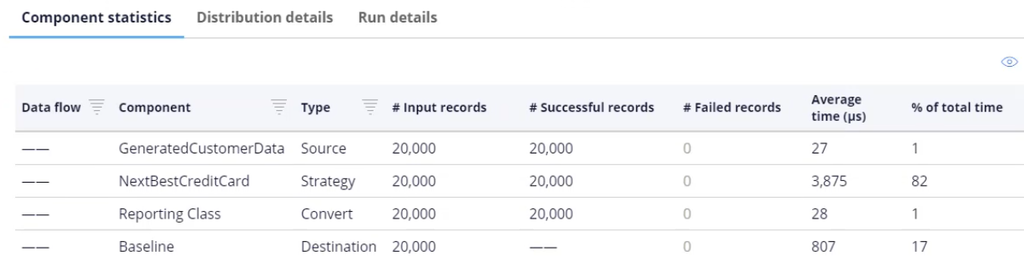
Once the simulation run completes, close the details screen.
To start analyzing the results of your test, click on the Baseline report that you just created. This will open Visual Business Director.
This is the 3-dimensional (3-D) view within Visual Business Director that allows you to easily analyze strategy results.
In the Data section, you can select which data source you are inspecting, and in which mode. Each simulation run writes its results to a data source. For now, since you executed a single run, you are looking at the Baseline data source, in Regular mode.
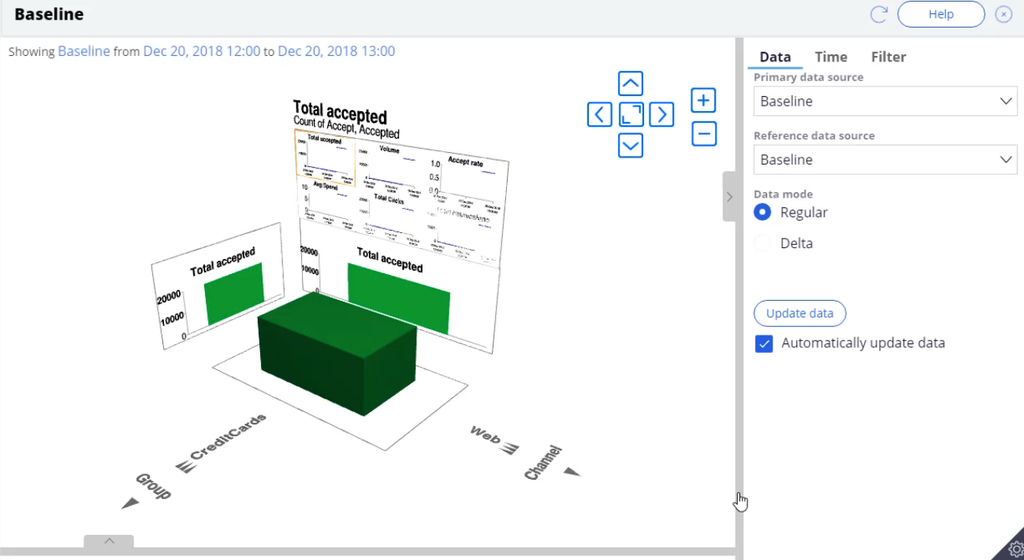
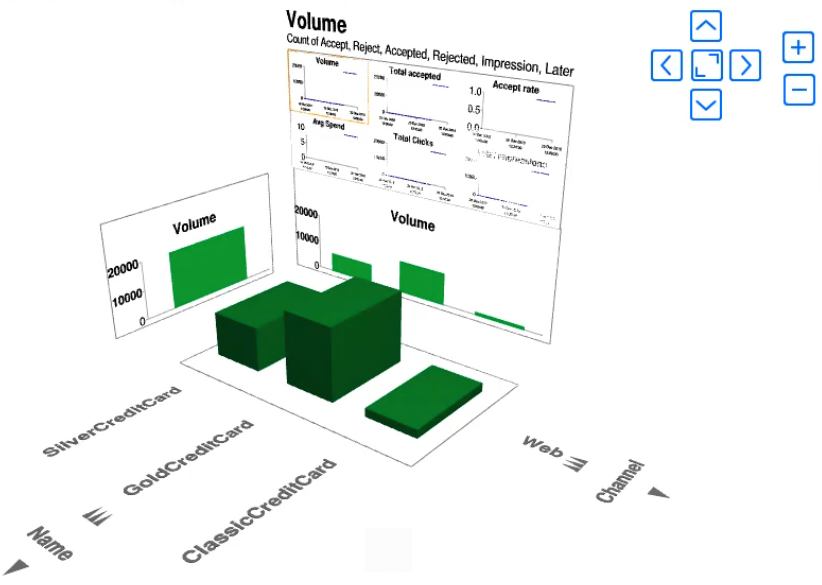
In the 3-D view, you can select a key performance indicator (KPI). If you want to look at the distribution of the propositions output by the strategy, click on the top of the back panel and select the Volume KPI.
In the 3-D view you can now see the total propositions output by the strategy. To see the volume of individual propositions, you can navigate the Action dimension from the Group level to the Proposition level.
You can also rotate the 3-D view to see the data from different perspectives. To do this, press and hold the right click button on your mouse, then move the mouse.
If you want to get back to the original view, you can press the home button. This is the middle square in the group of squares at the top right of the screen.
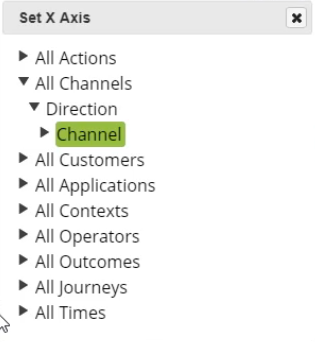
In Visual Business Director, you can inspect the results of the strategy in different dimensions. The current perspective shows proposition Name (the X axis) versus Channel (the Y axis). However, there are multiple dimensions for which you can analyze the results.
To change a dimension, click on it.
This pop-up shows the list of all dimensions you can use in Visual Business Director. You can select any of these dimensions to further analyze the strategy results. Note that in order to see relevant data, the corresponding properties need to be set in the decision strategy.
This video has concluded. What did it show you?
- How to create and execute a simulation test.
- How to analyze the results of a decision strategy on a large amount of input data.
- The basic functionality of Visual Business Director, including how to:
- Select a KPI.
- Navigate through a hierarchy.
- Change the perspective of the 3-dimensional view.
- Navigate to the home view and select a different dimension.
This Topic is available in the following Module:
If you are having problems with your training, please review the Pega Academy Support FAQs.
Want to help us improve this content?