Comparing results of multiple simulations
Introduction
Using Pega Visual Business Director, you can view the performance of actual or proposed strategies at a detailed level across all channels, products, or lines of business.
Video
Transcript
This video will show you how to simulate interactions with 20,000 customers and explore the results of alternative strategies.
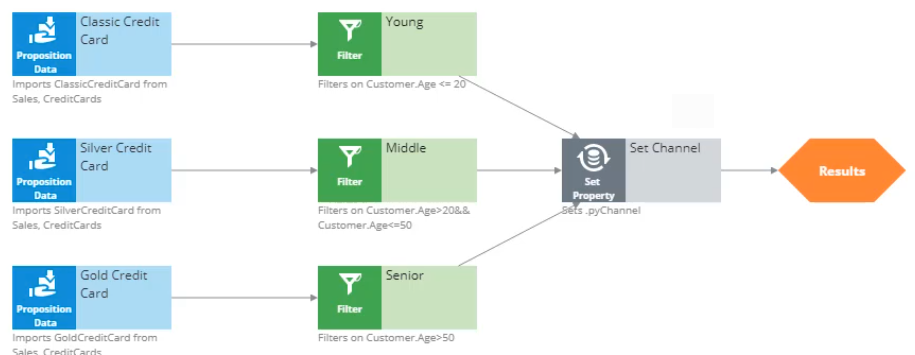
The decision strategy currently in production selects one of three credit card propositions: Classic, Silver or Gold. It then applies eligibility criteria based on Age.
Assume you have already executed a first simulation run against a sample customer data set. This simulation, which was run using the decision strategy before any changes were made, is called a baseline. The results are stored in the Baseline data source.
You now want to do a "what-if” analysis. You are interested in what the proposition distribution will be if you change eligibility criteria for the Silver and Gold credit cards.
Your task is to make a change to the decision strategy, create a new simulation run, and compare the results of the two simulations.
The current strategy offers the Silver credit card to customers under the age of 50, and the Gold credit card to customers over 50. You want to change this threshold to 40.
Once the change is made to the decision strategy, go ahead and create a simulation test.
Use the same input population you used for the Baseline execution. This ensures that the two simulation results will be comparable.
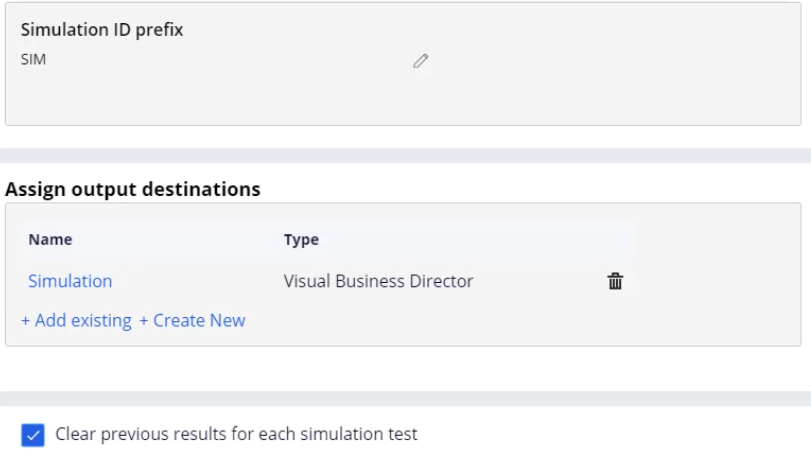
The first simulation result will be output to the Baseline data source. You want to output the second result to a new data source so you can compare them.
Name this data source Simulation.
Since you want to compare the results in Visual Business director, the data source should be of the same type.
You will also want to make multiple changes and re-execute the simulation, so you need to clear the previous simulation results.
Once the simulation configuration is complete, save the changes and start the execution.
When the execution finished, open the results in Visual Business Director by clicking on the data source.
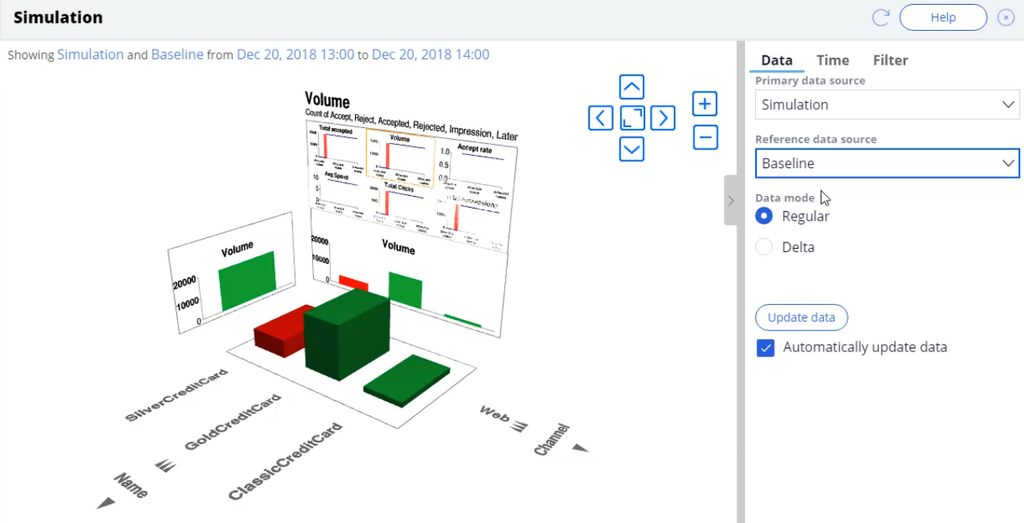
This is the Volume distribution of the three credit card offers after the change. You are now looking at the Simulation data source in Regular mode.
To analyze the impact of the strategy change, you can inspect the differences between the Simulation and Baseline data sources.
To do this, leave the Primary data source as Simulation and change the reference data source to Baseline.
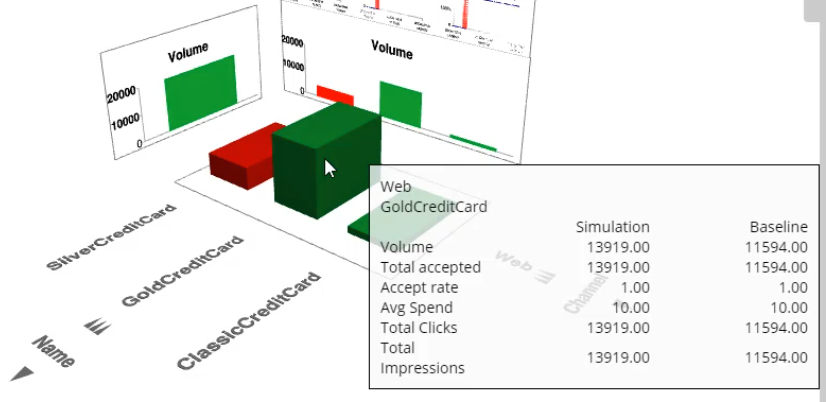
When you hover over a bar in the 3-D view, the Volume of the Gold credit card after the strategy change is shown in the Simulation column. The volume before the strategy change is shown in the Baseline column.
The green color indicates that the primary is higher than or equal to the reference value.
A red color indicates that the primary value is lower than the reference value.
To see the exact differences between the primary and reference sources, you can switch to Delta mode.
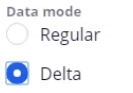
In Delta mode, the height of the shape indicates the absolute difference between the primary and reference data sources. In this example, you see that after the strategy change 2325 more Gold credit cards were offered.
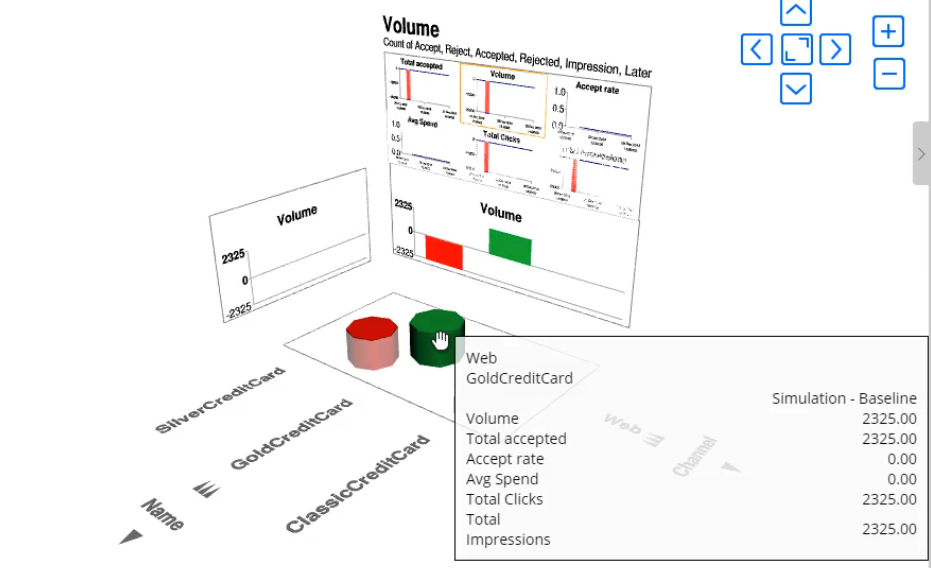
Notice that there is no delta for the Classic credit card because you didn’t change its eligibility criteria in the decision strategy.
If the value of the primary data source is higher, the shape is green, if it’s lower, the shape is red.
In this example, the red shape indicates that 2325 fewer Silver credit cards were offered after the change.
The results are in line with the strategy change. The strategy outputs more Gold cards and fewer Silver cards because you decreased the threshold for Silver credit cards from 50 to 40 years old.
After inspecting the simulation results, if the result is not satisfactory, you can make more changes to the strategy and re-execute the simulation. Suppose you want to do a more drastic change and reduce the threshold from 40 to 30 years old.
First, make the change to the decision strategy.
Once the change is done, you have two options. One, you can create a new simulation test and output the results to a third data source. This would allow you to compare the three results against each other.
Alternatively, you can re-execute the previous simulation test, which will override the previous results. To re-execute a simulation run, navigate to the simulation testing page.
This page shows an overview of all the simulations executed so far. Note that the Simulation ID column uses the prefix provided during the simulation setup. The first simulation run, shown here as SIM-1, is the Baseline. The second run, SIM-2, is the Simulation.
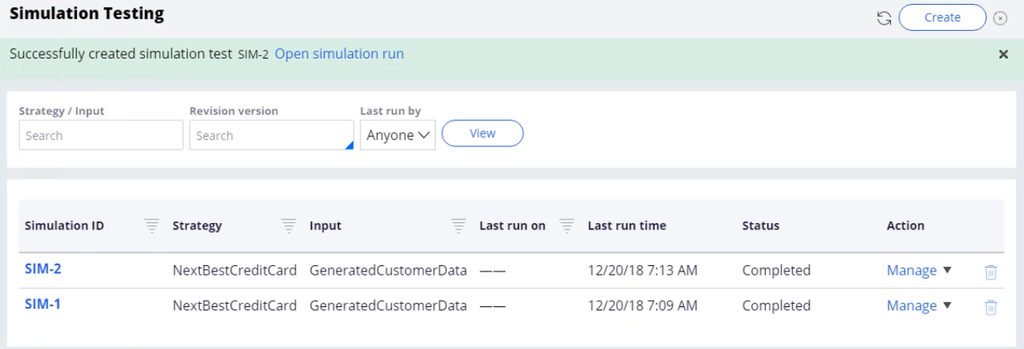
To re-execute a simulation run, open the simulation and click Restart.
Once the execution is complete, click on Simulation data source to see the results in Visual Business Director.
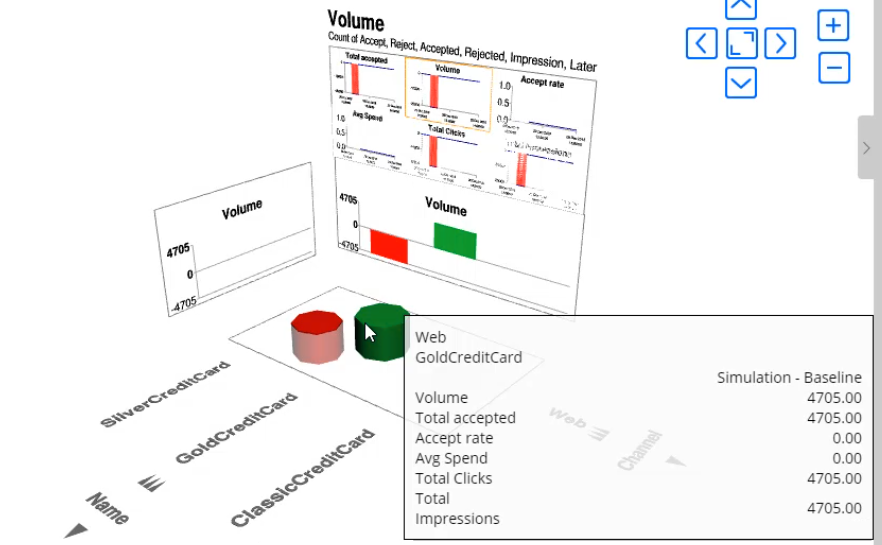
In Regular mode, you can see the new simulation results.
If you switch to Delta mode, you can see that the volume of Gold credit cards increased from 2325 to 4705.
This video has concluded. What did it show you?
- How to compare the results of two simulations following a change to a strategy.
- How to analyze the results of two simulation runs using Regular mode and Delta mode in Visual Business Director.
- How to access simulation executions and re-execute a simulation run.
This Topic is available in the following Module:
If you are having problems with your training, please review the Pega Academy Support FAQs.
Want to help us improve this content?